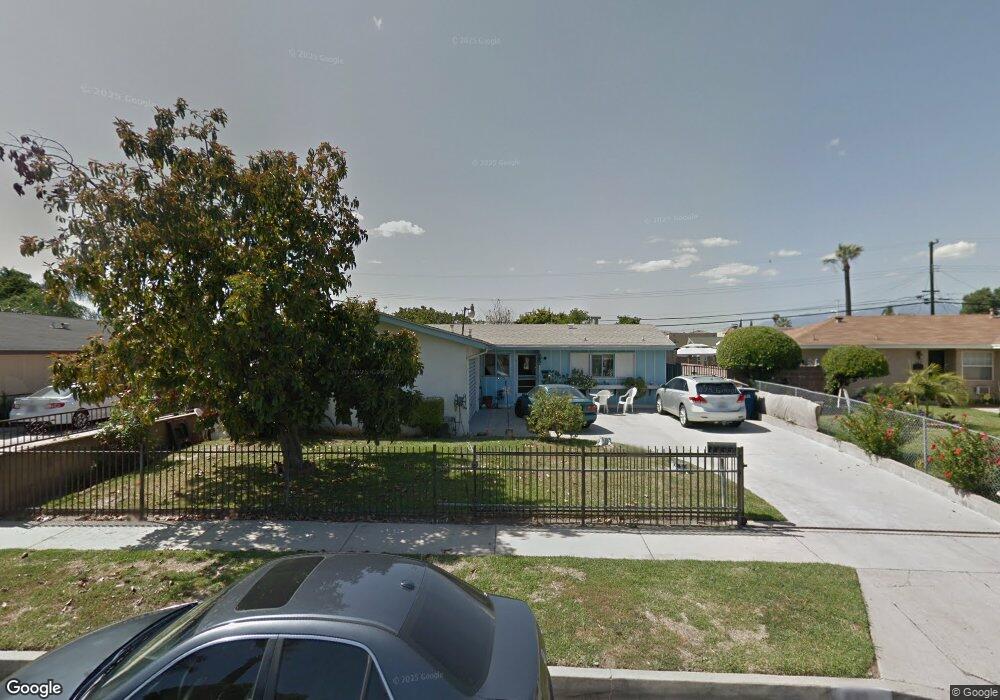
443 Cabana Ave La Puente, CA 91744
Estimated Value: $731,000 - $813,000
4
Beds
2
Baths
1,707
Sq Ft
$454/Sq Ft
Est. Value
About This Home
This home is located at 443 Cabana Ave, La Puente, CA 91744 and is currently estimated at $775,648, approximately $454 per square foot. 443 Cabana Ave is a home located in Los Angeles County with nearby schools including Nelson Elementary School, Sparks Middle School, and La Puente High School.
Ownership History
Date
Name
Owned For
Owner Type
Purchase Details
Closed on
Nov 1, 2019
Sold by
Bernabe Mauro
Bought by
Bernabe Mauro and Bernabe Lorraine
Current Estimated Value
Home Financials for this Owner
Home Financials are based on the most recent Mortgage that was taken out on this home.
Original Mortgage
$330,000
Outstanding Balance
$289,733
Interest Rate
3.5%
Estimated Equity
$485,915
Purchase Details
Closed on
Aug 27, 2015
Sold by
Bernabe Roland E
Bought by
Bernabe Mauro
Home Financials for this Owner
Home Financials are based on the most recent Mortgage that was taken out on this home.
Original Mortgage
$262,500
Interest Rate
4.05%
Mortgage Type
New Conventional
Purchase Details
Closed on
Aug 13, 2015
Sold by
Bernabe Bruno E
Bought by
Bernabe Mauro
Home Financials for this Owner
Home Financials are based on the most recent Mortgage that was taken out on this home.
Original Mortgage
$262,500
Interest Rate
4.05%
Mortgage Type
New Conventional
Create a Home Valuation Report for This Property
The Home Valuation Report is an in-depth analysis detailing your home's value as well as a comparison with similar homes in the area
Home Values in the Area
Average Home Value in this Area
Purchase History
| Date | Buyer | Sale Price | Title Company |
|---|---|---|---|
| Bernabe Mauro | -- | Chicago Title Company | |
| Bernabe Mauro | $129,000 | Western Resources Title | |
| Bernabe Mauro | -- | Western Resources Title | |
| Bernabe Mauro | $129,000 | Western Resources Title |
Source: Public Records
Mortgage History
| Date | Status | Borrower | Loan Amount |
|---|---|---|---|
| Open | Bernabe Mauro | $330,000 | |
| Previous Owner | Bernabe Mauro | $262,500 |
Source: Public Records
Tax History Compared to Growth
Tax History
| Year | Tax Paid | Tax Assessment Tax Assessment Total Assessment is a certain percentage of the fair market value that is determined by local assessors to be the total taxable value of land and additions on the property. | Land | Improvement |
|---|---|---|---|---|
| 2025 | $4,687 | $362,714 | $242,711 | $120,003 |
| 2024 | $4,687 | $355,602 | $237,952 | $117,650 |
| 2023 | $4,571 | $348,631 | $233,287 | $115,344 |
| 2022 | $4,441 | $341,796 | $228,713 | $113,083 |
| 2021 | $4,358 | $335,095 | $224,229 | $110,866 |
| 2019 | $4,235 | $325,158 | $217,579 | $107,579 |
| 2018 | $4,059 | $318,783 | $213,313 | $105,470 |
| 2016 | $3,759 | $306,406 | $205,031 | $101,375 |
| 2015 | $972 | $52,171 | $14,658 | $37,513 |
| 2014 | $969 | $51,150 | $14,371 | $36,779 |
Source: Public Records
Map
Nearby Homes
- 544 N Orange Ave Unit B
- 14612 Hutchcroft St
- 736 Tonopah Ave
- 433 Sunkist Ave
- 14421 Flynn St
- 14510 Amar Rd Unit J
- 750 Glenshaw Dr
- 452 Willow Ave
- 14940 Beckner St
- 610 Willow Ave
- 335 Willow Ave
- 357 Cadbrook Dr
- 13903 Moccasin St
- 822 Greenberry Dr
- 932 Shadydale Ave
- 14972 Giordano St
- 829 Foxworth Ave
- 320 S 5th Ave
- 227 S 4th Ave
- 421 S 5th Ave
- 437 Cabana Ave
- 449 Cabana Ave
- 459 Cabana Ave
- 420 Tonopah Ave
- 414 Tonopah Ave
- 431 Cabana Ave
- 455 Cabana Ave
- 426 Tonopah Ave
- 408 Tonopah Ave
- 444 Cabana Ave
- 438 Cabana Ave
- 425 Cabana Ave
- 461 Cabana Ave
- 432 Cabana Ave
- 452 Cabana Ave
- 402 Tonopah Ave
- 438 Tonopah Ave
- 426 Cabana Ave
- 419 Cabana Ave
- 460 Cabana Ave