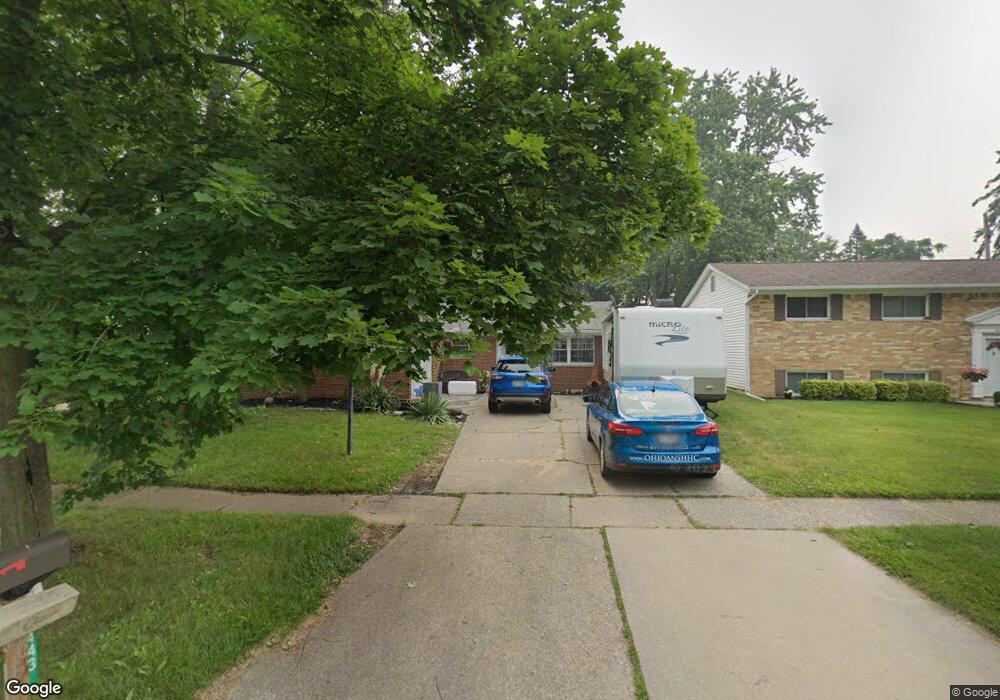
443 Shrewsbury St Holland, OH 43528
Estimated Value: $151,000 - $198,000
3
Beds
1
Bath
1,183
Sq Ft
$146/Sq Ft
Est. Value
About This Home
This home is located at 443 Shrewsbury St, Holland, OH 43528 and is currently estimated at $172,406, approximately $145 per square foot. 443 Shrewsbury St is a home located in Lucas County with nearby schools including Holland Elementary School, Springfield Middle School, and Springfield High School.
Ownership History
Date
Name
Owned For
Owner Type
Purchase Details
Closed on
Jun 15, 2009
Sold by
Miller Adam T and Torres Lisa A
Bought by
Miller Adam T
Current Estimated Value
Home Financials for this Owner
Home Financials are based on the most recent Mortgage that was taken out on this home.
Original Mortgage
$75,605
Outstanding Balance
$47,974
Interest Rate
4.85%
Mortgage Type
FHA
Estimated Equity
$124,432
Purchase Details
Closed on
Jun 3, 2009
Sold by
Federal Home Loan Mortgage Corporation
Bought by
Miller Adam T and Torres Lisa A
Home Financials for this Owner
Home Financials are based on the most recent Mortgage that was taken out on this home.
Original Mortgage
$75,605
Outstanding Balance
$47,974
Interest Rate
4.85%
Mortgage Type
FHA
Estimated Equity
$124,432
Purchase Details
Closed on
Jan 2, 2009
Sold by
Trammell Mary
Bought by
Federal Home Loan Mortgage Corp
Create a Home Valuation Report for This Property
The Home Valuation Report is an in-depth analysis detailing your home's value as well as a comparison with similar homes in the area
Home Values in the Area
Average Home Value in this Area
Purchase History
| Date | Buyer | Sale Price | Title Company |
|---|---|---|---|
| Miller Adam T | -- | Chicago Title Insurance Co | |
| Miller Adam T | $77,000 | Chicago Title Insurance Co | |
| Federal Home Loan Mortgage Corp | $60,000 | None Available |
Source: Public Records
Mortgage History
| Date | Status | Borrower | Loan Amount |
|---|---|---|---|
| Open | Miller Adam T | $75,605 |
Source: Public Records
Tax History Compared to Growth
Tax History
| Year | Tax Paid | Tax Assessment Tax Assessment Total Assessment is a certain percentage of the fair market value that is determined by local assessors to be the total taxable value of land and additions on the property. | Land | Improvement |
|---|---|---|---|---|
| 2024 | $1,495 | $48,790 | $13,580 | $35,210 |
| 2023 | $2,547 | $36,365 | $10,920 | $25,445 |
| 2022 | $2,537 | $36,365 | $10,920 | $25,445 |
| 2021 | $2,404 | $36,365 | $10,920 | $25,445 |
| 2020 | $2,228 | $30,765 | $8,225 | $22,540 |
| 2019 | $2,177 | $30,765 | $8,225 | $22,540 |
| 2018 | $2,219 | $30,765 | $8,225 | $22,540 |
| 2017 | $2,276 | $30,065 | $8,050 | $22,015 |
| 2016 | $2,297 | $85,900 | $23,000 | $62,900 |
| 2015 | $2,293 | $85,900 | $23,000 | $62,900 |
| 2014 | $2,030 | $28,920 | $7,740 | $21,180 |
| 2013 | $2,030 | $28,920 | $7,740 | $21,180 |
Source: Public Records
Map
Nearby Homes
- 426 Cheswick Rd
- 352 Cheswick St
- 342 S Harefoote St
- 324 Harefoote St
- 642 Diana Dr
- 640 Quigley St
- 319 S Mccord Rd
- 508 Crystal Lake Dr
- 6130 White Oak Dr
- 6607 Hill Ave
- 6339 Hill Ave
- 6855 Wharton Rd
- 617 & 621 S Mccord Rd
- 127 N Dorcas Rd
- 217 Pebble Beach Dr
- 7109 Springfield Hills Dr S
- 6324 Bapst Ave
- 312 Hayes Rd
- 715 S Holland Sylvania Rd
- 6268 Timberside Dr
- 437 Shrewsbury St
- 449 Shrewsbury St
- 457 Clarion Ave
- 431 Shrewsbury St
- 6510 South Ave
- 457 Shrewsbury Rd
- 457 Shrewsbury St
- 414 Roseanna Dr
- 425 Shrewsbury St
- 426 Cheswick St
- 408 Roseanna Dr
- 450 Shrewsbury St
- 428 Shrewsbury St
- 458 Shrewsbury St
- 419 Shrewsbury St
- 404 Roseanna Dr
- 419 Cheswick St
- 6454 South Ave
- 6534 South Ave
- 510 Clarion Ave