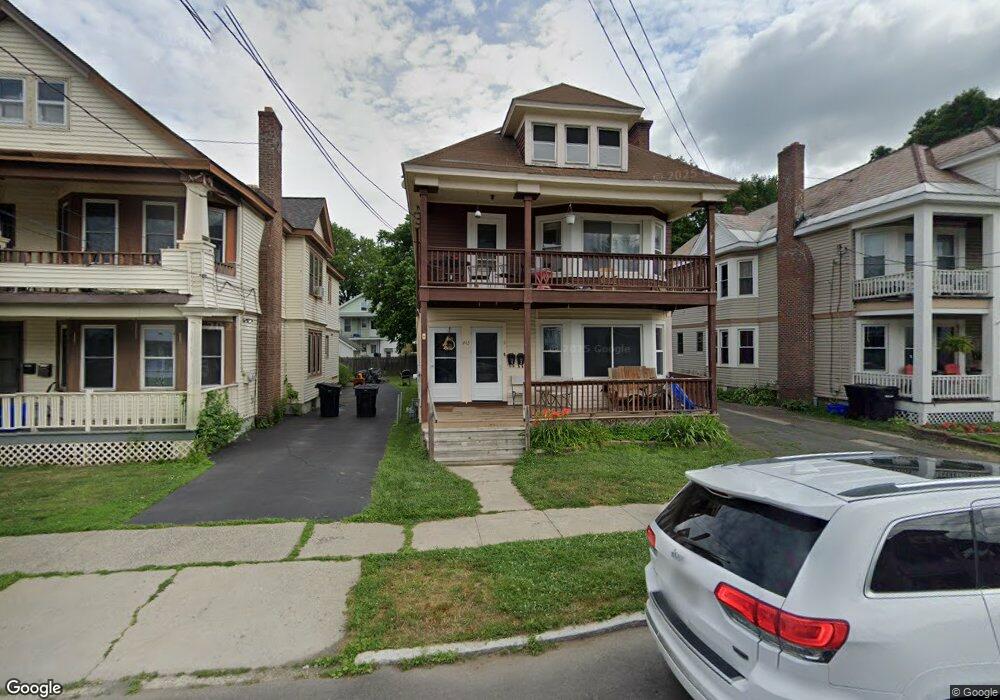
443 Taylor Ct Troy, NY 12180
Frear Park NeighborhoodEstimated Value: $270,903 - $313,000
6
Beds
2
Baths
2,600
Sq Ft
$112/Sq Ft
Est. Value
About This Home
This home is located at 443 Taylor Ct, Troy, NY 12180 and is currently estimated at $290,976, approximately $111 per square foot. 443 Taylor Ct is a home located in Rensselaer County with nearby schools including P.S. 18, W. Kenneth Doyle Middle School, and Troy High School.
Ownership History
Date
Name
Owned For
Owner Type
Purchase Details
Closed on
Aug 23, 2018
Sold by
Bates Dennis
Bought by
Hobbins Nathan B and Hobbins Christina R
Current Estimated Value
Home Financials for this Owner
Home Financials are based on the most recent Mortgage that was taken out on this home.
Original Mortgage
$196,278
Outstanding Balance
$169,970
Interest Rate
4.37%
Mortgage Type
FHA
Estimated Equity
$121,006
Purchase Details
Closed on
Oct 31, 2005
Sold by
Powis Rodney C
Bought by
Bates
Home Financials for this Owner
Home Financials are based on the most recent Mortgage that was taken out on this home.
Original Mortgage
$119,100
Interest Rate
5.85%
Mortgage Type
Purchase Money Mortgage
Purchase Details
Closed on
Jul 20, 2005
Purchase Details
Closed on
Feb 12, 2004
Sold by
Bruno Joseph L
Bought by
Powis Rodney
Create a Home Valuation Report for This Property
The Home Valuation Report is an in-depth analysis detailing your home's value as well as a comparison with similar homes in the area
Home Values in the Area
Average Home Value in this Area
Purchase History
| Date | Buyer | Sale Price | Title Company |
|---|---|---|---|
| Hobbins Nathan B | $199,900 | -- | |
| Bates | $127,000 | David Fryer | |
| Powis Rodney | -- | Alyssa Woblleber | |
| -- | -- | -- | |
| Powis Rodney | $11,863 | Alyssa Wohiieber |
Source: Public Records
Mortgage History
| Date | Status | Borrower | Loan Amount |
|---|---|---|---|
| Open | Hobbins Nathan B | $196,278 | |
| Previous Owner | Powis Rodney | $119,100 |
Source: Public Records
Tax History Compared to Growth
Tax History
| Year | Tax Paid | Tax Assessment Tax Assessment Total Assessment is a certain percentage of the fair market value that is determined by local assessors to be the total taxable value of land and additions on the property. | Land | Improvement |
|---|---|---|---|---|
| 2024 | $7,473 | $160,000 | $11,000 | $149,000 |
| 2023 | $7,388 | $160,000 | $11,000 | $149,000 |
| 2022 | $7,249 | $160,000 | $11,000 | $149,000 |
| 2021 | $1,822 | $160,000 | $11,000 | $149,000 |
| 2020 | $3,685 | $160,000 | $11,000 | $149,000 |
| 2019 | $4,598 | $160,000 | $11,000 | $149,000 |
| 2018 | $4,598 | $160,000 | $11,000 | $149,000 |
| 2017 | $4,587 | $160,000 | $11,000 | $149,000 |
| 2016 | $6,275 | $160,000 | $11,000 | $149,000 |
| 2015 | -- | $160,000 | $11,000 | $149,000 |
| 2014 | -- | $160,000 | $11,000 | $149,000 |
Source: Public Records
Map
Nearby Homes