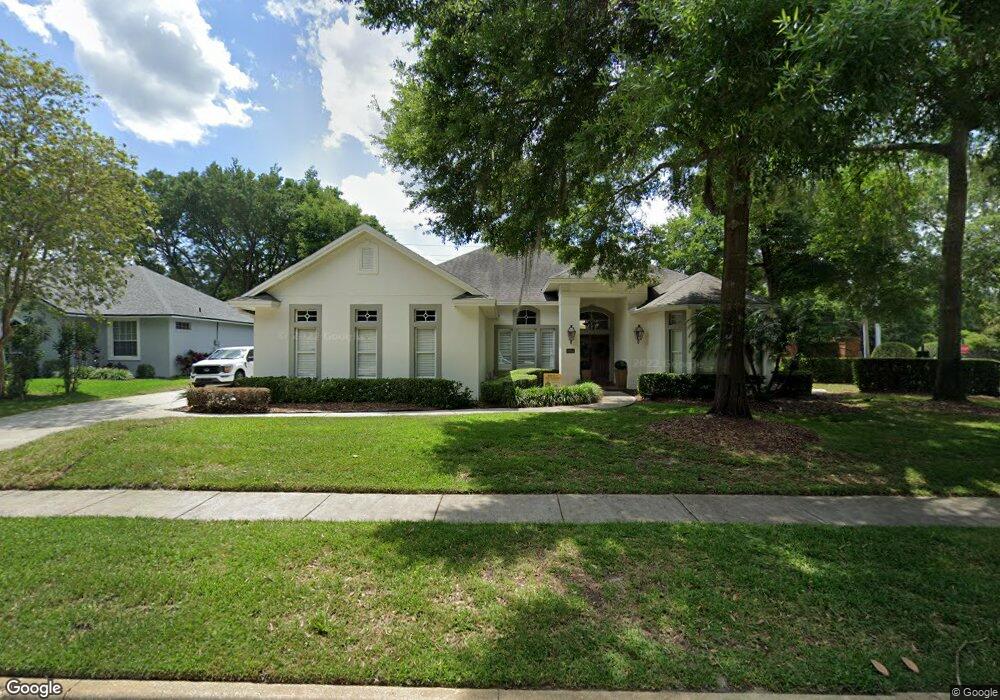
4430 Clear River Ct Orlando, FL 32817
Estimated Value: $676,771 - $705,000
3
Beds
3
Baths
2,913
Sq Ft
$237/Sq Ft
Est. Value
About This Home
This home is located at 4430 Clear River Ct, Orlando, FL 32817 and is currently estimated at $690,693, approximately $237 per square foot. 4430 Clear River Ct is a home located in Orange County with nearby schools including Riverdale Elementary School, Corner Lake Middle School, and University High School.
Ownership History
Date
Name
Owned For
Owner Type
Purchase Details
Closed on
Jun 29, 2007
Sold by
Parkerson Nicole R
Bought by
Peckham David J and Peckham Megan P
Current Estimated Value
Home Financials for this Owner
Home Financials are based on the most recent Mortgage that was taken out on this home.
Original Mortgage
$360,000
Outstanding Balance
$225,012
Interest Rate
6.5%
Mortgage Type
New Conventional
Estimated Equity
$465,681
Purchase Details
Closed on
Jun 28, 2004
Sold by
Williams Nicole R
Bought by
Williams Nicole R
Purchase Details
Closed on
Feb 11, 2000
Sold by
Kauffman Zachary S and Kauffman Sally K
Bought by
Williams Michael P and Williams Nicole R
Home Financials for this Owner
Home Financials are based on the most recent Mortgage that was taken out on this home.
Original Mortgage
$239,900
Interest Rate
8.11%
Mortgage Type
New Conventional
Create a Home Valuation Report for This Property
The Home Valuation Report is an in-depth analysis detailing your home's value as well as a comparison with similar homes in the area
Home Values in the Area
Average Home Value in this Area
Purchase History
| Date | Buyer | Sale Price | Title Company |
|---|---|---|---|
| Peckham David J | $450,000 | Allied Abstract & Title Comp | |
| Williams Nicole R | -- | -- | |
| Williams Michael P | $299,900 | -- |
Source: Public Records
Mortgage History
| Date | Status | Borrower | Loan Amount |
|---|---|---|---|
| Open | Peckham David J | $360,000 | |
| Previous Owner | Williams Michael P | $258,800 | |
| Previous Owner | Williams Michael P | $25,000 | |
| Previous Owner | Williams Michael P | $239,900 |
Source: Public Records
Tax History Compared to Growth
Tax History
| Year | Tax Paid | Tax Assessment Tax Assessment Total Assessment is a certain percentage of the fair market value that is determined by local assessors to be the total taxable value of land and additions on the property. | Land | Improvement |
|---|---|---|---|---|
| 2025 | $4,707 | $300,677 | -- | -- |
| 2024 | $4,370 | $300,677 | -- | -- |
| 2023 | $4,370 | $283,692 | $0 | $0 |
| 2022 | $4,188 | $275,429 | $0 | $0 |
| 2021 | $4,173 | $267,407 | $0 | $0 |
| 2020 | $3,971 | $263,715 | $0 | $0 |
| 2019 | $4,088 | $257,786 | $0 | $0 |
| 2018 | $4,056 | $252,979 | $0 | $0 |
| 2017 | $3,990 | $328,148 | $57,500 | $270,648 |
| 2016 | $3,956 | $313,575 | $50,000 | $263,575 |
| 2015 | $4,009 | $306,133 | $50,000 | $256,133 |
| 2014 | $4,060 | $300,779 | $57,000 | $243,779 |
Source: Public Records
Map
Nearby Homes
- 4408 Calm Water Ct
- 4413 Riverton Dr
- 4605 Riverton Dr
- Lot 7E Iron Bridge Rd
- 3718 Rouse Rd
- 10805 Oak Glen Cir
- 3824 Greystone Legend Place
- 3718 Savannah Loop
- 10544 Wyndcliff Dr
- 10519 Wyndcliff Dr
- 3650 Oakdale Cir Unit 100
- 3658 Oakdale Cir Unit 100
- 160 Reserve Cir Unit 100
- 141 Reserve Cir Unit 113
- 10315 Taraby Ct
- 144 Reserve Cir Unit 112
- 5655 Oak Hollow Ln
- 172 Reserve Cir Unit 108
- 128 Reserve Cir Unit 208
- 4316 Sandhurst Dr
- 4424 Clear River Ct
- 4425 Clear River Ct
- 11301 Riverbank Blvd
- 4418 Clear River Ct
- 11307 Riverbank Blvd
- 4419 Clear River Ct
- 11313 Riverbank Blvd
- 4412 Clear River Ct
- 11319 Riverbank Blvd
- 4413 Clear River Ct
- 4426 Calm Water Ct
- 4420 Calm Water Ct
- 4401 Clear River Ct Unit 1
- 11325 Riverbank Blvd
- 4508 Stone Hedge Dr
- 4406 Clear River Ct
- 4414 Calm Water Ct
- 4400 Clear River Ct
- 4516 Stone Hedge Dr