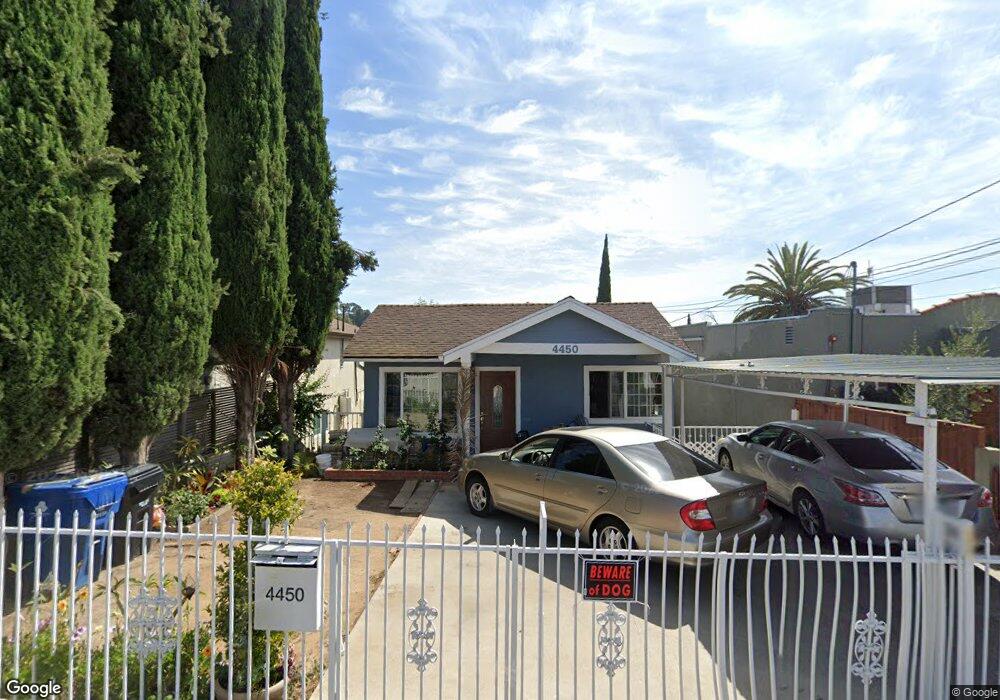
4450 Mont Eagle Place Los Angeles, CA 90041
Eagle Rock NeighborhoodEstimated Value: $998,000 - $1,206,000
2
Beds
1
Bath
1,312
Sq Ft
$832/Sq Ft
Est. Value
About This Home
This home is located at 4450 Mont Eagle Place, Los Angeles, CA 90041 and is currently estimated at $1,091,504, approximately $831 per square foot. 4450 Mont Eagle Place is a home located in Los Angeles County with nearby schools including Toland Way Elementary School, Benjamin Franklin High School, and Eagle Rock High School.
Ownership History
Date
Name
Owned For
Owner Type
Purchase Details
Closed on
Dec 10, 1997
Sold by
Diversified Properties
Bought by
Leyva Jesus M and Leyva Esthela E
Current Estimated Value
Home Financials for this Owner
Home Financials are based on the most recent Mortgage that was taken out on this home.
Original Mortgage
$125,511
Outstanding Balance
$20,326
Interest Rate
7.13%
Mortgage Type
FHA
Estimated Equity
$1,071,178
Purchase Details
Closed on
Jul 9, 1997
Sold by
Lim Vedasto B
Bought by
Diversified Properties
Purchase Details
Closed on
Dec 22, 1995
Sold by
Lim Vedasto B
Bought by
Lim Vedasto B
Home Financials for this Owner
Home Financials are based on the most recent Mortgage that was taken out on this home.
Original Mortgage
$75,000
Interest Rate
6.99%
Create a Home Valuation Report for This Property
The Home Valuation Report is an in-depth analysis detailing your home's value as well as a comparison with similar homes in the area
Home Values in the Area
Average Home Value in this Area
Purchase History
| Date | Buyer | Sale Price | Title Company |
|---|---|---|---|
| Leyva Jesus M | $126,500 | Fidelity National Title Co | |
| Diversified Properties | $16,861 | Old Republic Title | |
| Lim Vedasto B | -- | California Counties Title Co |
Source: Public Records
Mortgage History
| Date | Status | Borrower | Loan Amount |
|---|---|---|---|
| Open | Leyva Jesus M | $125,511 | |
| Previous Owner | Lim Vedasto B | $75,000 |
Source: Public Records
Tax History Compared to Growth
Tax History
| Year | Tax Paid | Tax Assessment Tax Assessment Total Assessment is a certain percentage of the fair market value that is determined by local assessors to be the total taxable value of land and additions on the property. | Land | Improvement |
|---|---|---|---|---|
| 2025 | $2,577 | $201,959 | $138,742 | $63,217 |
| 2024 | $2,529 | $198,000 | $136,022 | $61,978 |
| 2023 | $2,482 | $194,118 | $133,355 | $60,763 |
| 2022 | $2,368 | $190,313 | $130,741 | $59,572 |
| 2021 | $2,332 | $186,582 | $128,178 | $58,404 |
| 2020 | $2,351 | $184,670 | $126,864 | $57,806 |
| 2019 | $2,263 | $181,050 | $124,377 | $56,673 |
| 2018 | $2,213 | $177,501 | $121,939 | $55,562 |
| 2016 | $2,100 | $170,610 | $117,205 | $53,405 |
| 2015 | $2,070 | $168,048 | $115,445 | $52,603 |
| 2014 | $2,085 | $164,757 | $113,184 | $51,573 |
Source: Public Records
Map
Nearby Homes
- 4263 Barryknoll Dr
- 4312 Division St
- 4500 Mont Eagle Place
- 1070 N Oban Dr
- 3538 W Avenue 42
- 4654 Toland Way
- 3919 Barryknoll Dr
- 3701 Barryknoll Dr
- 3865 Barryknoll Dr
- 3861 Barryknoll Dr
- 3871 Barryknoll Dr
- 4200 Toland Way
- 1046 Oban Dr
- 1087 Oneonta Dr
- 1038 Oban Dr
- 4707 Toland Way
- 4322 Scandia Way
- 4824 Toland Way
- 1553 Verbena Way
- 4013 Division St
- 4448 Mont Eagle Place
- 4452 Mont Eagle Place
- 4456 Mont Eagle Place
- 4444 Mont Eagle Place
- 4440 Mont Eagle Place
- 4460 Mont Eagle Place
- 4458 Mont Eagle Place
- 4434 Mont Eagle Place
- 1280 El Paso Dr
- 1278 El Paso Dr
- 4468 Mont Eagle Place
- 1272 El Paso Dr
- 4428 Mont Eagle Place
- 4455 Mont Eagle Place
- 4457 Mont Eagle Place
- 4449 Mont Eagle Place
- 1270 El Paso Dr
- 4474 Mont Eagle Place
- 4461 Mont Eagle Place
- 4447 Mont Eagle Place