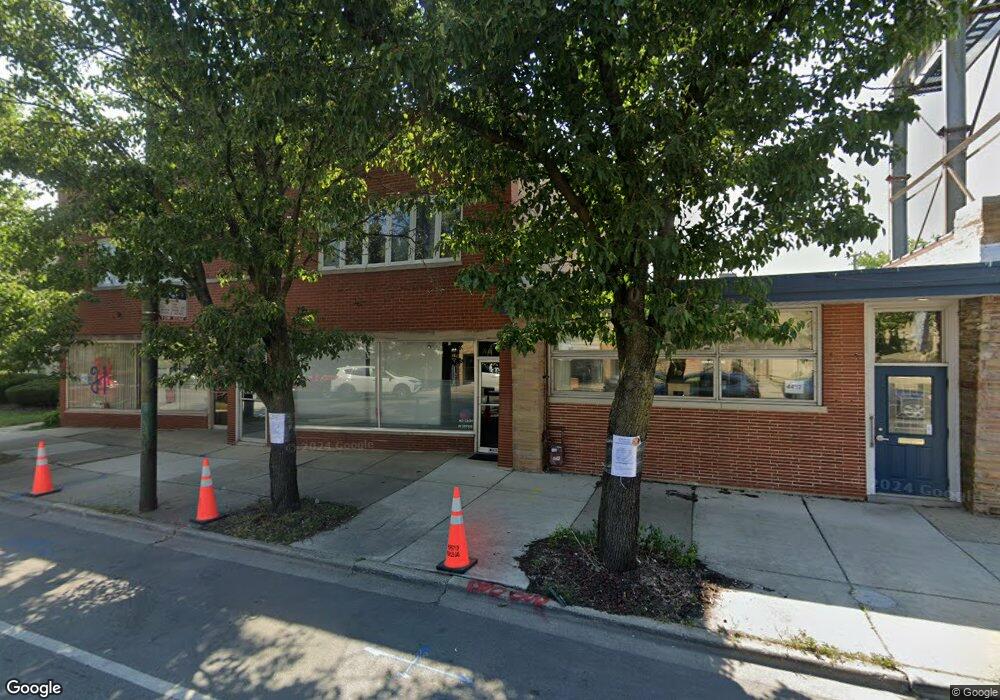
4450 N Central Ave Chicago, IL 60630
Jefferson Park NeighborhoodEstimated Value: $316,000 - $1,128,000
--
Bed
10
Baths
--
Sq Ft
3,136
Sq Ft Lot
About This Home
This home is located at 4450 N Central Ave, Chicago, IL 60630 and is currently estimated at $722,000. 4450 N Central Ave is a home located in Cook County with nearby schools including Prussing Elementary School, William Howard Taft High School, and St. Robert Bellarmine Catholic School.
Ownership History
Date
Name
Owned For
Owner Type
Purchase Details
Closed on
Jan 2, 2025
Sold by
Sugrue Shawn E and Sugrue Mary M
Bought by
Raulli Ernest and Raulli Kathleen
Current Estimated Value
Home Financials for this Owner
Home Financials are based on the most recent Mortgage that was taken out on this home.
Original Mortgage
$305,000
Outstanding Balance
$276,344
Interest Rate
6.1%
Mortgage Type
Seller Take Back
Estimated Equity
$445,656
Purchase Details
Closed on
Mar 18, 2024
Sold by
Sugrue Shawn E and Sugrue Mary M
Bought by
Raulli Ernest and Raulli Kathleen
Purchase Details
Closed on
Mar 13, 2002
Sold by
Franklin Marie G and Franklin Richard D
Bought by
Sugrue Shawn E and Sugrue Mary M
Home Financials for this Owner
Home Financials are based on the most recent Mortgage that was taken out on this home.
Original Mortgage
$250,000
Interest Rate
7.11%
Mortgage Type
Commercial
Create a Home Valuation Report for This Property
The Home Valuation Report is an in-depth analysis detailing your home's value as well as a comparison with similar homes in the area
Home Values in the Area
Average Home Value in this Area
Purchase History
| Date | Buyer | Sale Price | Title Company |
|---|---|---|---|
| Raulli Ernest | $305,000 | None Listed On Document | |
| Raulli Ernest | $270,000 | None Listed On Document | |
| Sugrue Shawn E | -- | -- | |
| Sugrue Shawn E | -- | -- |
Source: Public Records
Mortgage History
| Date | Status | Borrower | Loan Amount |
|---|---|---|---|
| Open | Raulli Ernest | $305,000 | |
| Previous Owner | Sugrue Shawn E | $250,000 |
Source: Public Records
Tax History Compared to Growth
Tax History
| Year | Tax Paid | Tax Assessment Tax Assessment Total Assessment is a certain percentage of the fair market value that is determined by local assessors to be the total taxable value of land and additions on the property. | Land | Improvement |
|---|---|---|---|---|
| 2024 | $6,620 | $39,090 | $10,938 | $28,152 |
| 2023 | $6,453 | $31,375 | $8,750 | $22,625 |
| 2022 | $6,453 | $31,375 | $8,750 | $22,625 |
| 2021 | $6,309 | $31,375 | $8,750 | $22,625 |
| 2020 | $4,780 | $21,456 | $4,531 | $16,925 |
| 2019 | $4,955 | $24,663 | $4,531 | $20,132 |
| 2018 | $4,872 | $24,663 | $4,531 | $20,132 |
| 2017 | $4,582 | $21,287 | $4,062 | $17,225 |
| 2016 | $4,264 | $21,287 | $4,062 | $17,225 |
| 2015 | $3,901 | $21,287 | $4,062 | $17,225 |
| 2014 | $3,472 | $18,714 | $3,750 | $14,964 |
| 2013 | $3,404 | $18,714 | $3,750 | $14,964 |
Source: Public Records
Map
Nearby Homes
- 5704 W Montrose Ave Unit 2B
- 5448 W Agatite Ave
- 5516 W Windsor Ave Unit 2M
- 5738 W Windsor Ave
- 5416 W Windsor Ave Unit 1N
- 5401 W Montrose Ave
- 5352 W Sunnyside Ave
- 5354 W Montrose Ave
- 4414 N Monitor Ave
- 5710 W Leland Ave
- 5410 W Hutchinson St
- 5330 W Windsor Ave Unit 3I
- 4256 N Monitor Ave
- 4230 N Monitor Ave
- 5501 W Lawrence Ave Unit 3C
- 5447 W Lawrence Ave Unit 301
- 5741 W Lawrence Ave Unit 2
- 5844 W Leland Ave
- 5253 W Cullom Ave
- 5940 W Wilson Ave
- 4448 N Central Ave
- 4444 N Central Ave Unit 2N
- 4444 N Central Ave Unit 1GW
- 4444 N Central Ave Unit 1GN
- 4444 N Central Ave Unit 1N
- 4444 N Central Ave Unit 1W
- 4444 N Central Ave
- 4444 N Central Ave Unit 1E
- 4440 N Central Ave Unit GW
- 4440 N Central Ave Unit 2E
- 4440 N Central Ave Unit 2W
- 4440 N Central Ave Unit 1E
- 4440 N Central Ave Unit GE
- 4440 N Central Ave Unit 1W
- 4436 N Central Ave
- 4451 N Central Ave
- 4453 N Central Ave
- 4445 N Central Ave Unit 3E
- 4445 N Central Ave Unit 2W
- 4445 N Central Ave Unit 3W