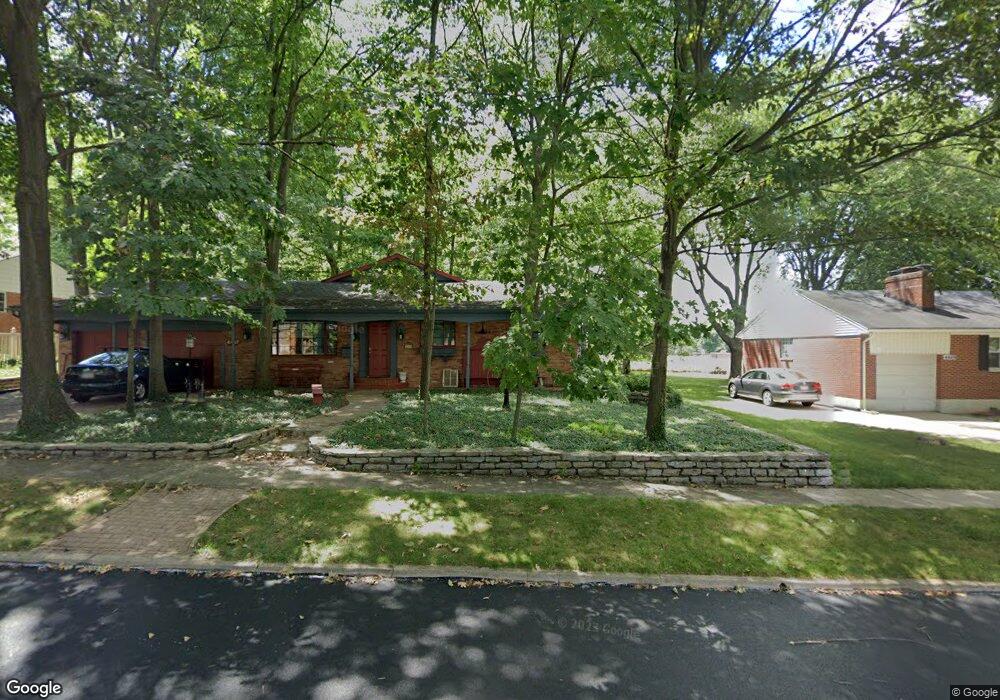
4457 Wing View Ln Dayton, OH 45429
Estimated Value: $230,000 - $339,000
3
Beds
2
Baths
2,160
Sq Ft
$141/Sq Ft
Est. Value
About This Home
This home is located at 4457 Wing View Ln, Dayton, OH 45429 and is currently estimated at $304,175, approximately $140 per square foot. 4457 Wing View Ln is a home located in Montgomery County with nearby schools including Oakview Elementary School, Van Buren Middle School, and Kettering Fairmont High School.
Ownership History
Date
Name
Owned For
Owner Type
Purchase Details
Closed on
May 17, 2022
Sold by
Payne Stephanie L and Payne Matthew C
Bought by
Payne Matthew C
Current Estimated Value
Purchase Details
Closed on
Jul 21, 2017
Sold by
Payne Matthew C and Payne Stephanie L
Bought by
Payne Matthew C and Payne Stephanie L
Home Financials for this Owner
Home Financials are based on the most recent Mortgage that was taken out on this home.
Original Mortgage
$138,000
Interest Rate
3.9%
Mortgage Type
New Conventional
Purchase Details
Closed on
Oct 19, 2016
Sold by
Shank Paul M
Bought by
Matthew C Payne
Home Financials for this Owner
Home Financials are based on the most recent Mortgage that was taken out on this home.
Interest Rate
3.47%
Purchase Details
Closed on
Jun 30, 2014
Sold by
Shank Jean K and Shank Paul M
Bought by
Shank Paul M and Shank Jean K
Purchase Details
Closed on
Jun 2, 1998
Sold by
Shank Paul M and Shank Jean K
Bought by
Shank Jean K and Shank Paul M
Create a Home Valuation Report for This Property
The Home Valuation Report is an in-depth analysis detailing your home's value as well as a comparison with similar homes in the area
Home Values in the Area
Average Home Value in this Area
Purchase History
| Date | Buyer | Sale Price | Title Company |
|---|---|---|---|
| Payne Matthew C | -- | Payne Stephanie L | |
| Payne Matthew C | -- | Landmark Title Agency South | |
| Matthew C Payne | $169,900 | -- | |
| Shank Paul M | -- | None Available | |
| Shank Jean K | -- | -- |
Source: Public Records
Mortgage History
| Date | Status | Borrower | Loan Amount |
|---|---|---|---|
| Previous Owner | Payne Matthew C | $138,000 | |
| Previous Owner | Matthew C Payne | -- |
Source: Public Records
Tax History Compared to Growth
Tax History
| Year | Tax Paid | Tax Assessment Tax Assessment Total Assessment is a certain percentage of the fair market value that is determined by local assessors to be the total taxable value of land and additions on the property. | Land | Improvement |
|---|---|---|---|---|
| 2024 | $5,833 | $94,190 | $14,620 | $79,570 |
| 2023 | $5,833 | $94,190 | $14,620 | $79,570 |
| 2022 | $5,558 | $70,980 | $10,990 | $59,990 |
| 2021 | $5,140 | $70,980 | $10,990 | $59,990 |
| 2020 | $5,157 | $70,980 | $10,990 | $59,990 |
| 2019 | $4,315 | $52,490 | $10,000 | $42,490 |
| 2018 | $4,338 | $52,490 | $10,000 | $42,490 |
| 2017 | $3,995 | $52,490 | $10,000 | $42,490 |
| 2016 | $3,097 | $46,920 | $10,000 | $36,920 |
| 2015 | $2,958 | $46,920 | $10,000 | $36,920 |
| 2014 | $2,958 | $46,920 | $10,000 | $36,920 |
| 2012 | -- | $46,650 | $9,990 | $36,660 |
Source: Public Records
Map
Nearby Homes
- 804 Lovetta Dr
- 791 Willowdale Ave
- 4259 Maxlin Rd
- 1008 Rio Ln
- 617 Laurelann Dr
- 4817 Ackerman Blvd
- 959 Kimberly Dr
- 1033 Carlo Dr
- 1013 Swango Dr
- 501 Judith Dr
- 4808 Judith Dr
- 1049 Georgian Dr
- 4816 Judith Dr
- 5017 Ackerman Blvd
- 1105 Greenridge Dr
- 4640 Marshall Rd
- 4824 Far Hills Ave
- 101 Enid Ave
- 3822 Milford Dr
- 1328 Willowdale Ave
- 4465 Wing View Ln
- 4449 Wing View Ln
- 4441 Wing View Ln
- 4424 Wing View Ln
- 4440 Wing View Ln
- 4416 Wing View Ln
- 4481 Wing View Ln
- 4433 Wing View Ln
- 4448 Wing View Ln
- 4408 Wing View Ln
- 4425 Ackerman Blvd
- 4433 Ackerman Blvd
- 4417 Ackerman Blvd
- 4441 Ackerman Blvd
- 841 E David Rd
- 4409 Ackerman Blvd
- 4425 Wing View Ln
- 4449 Ackerman Blvd
- 851 E David Rd
- 4400 Wing View Ln