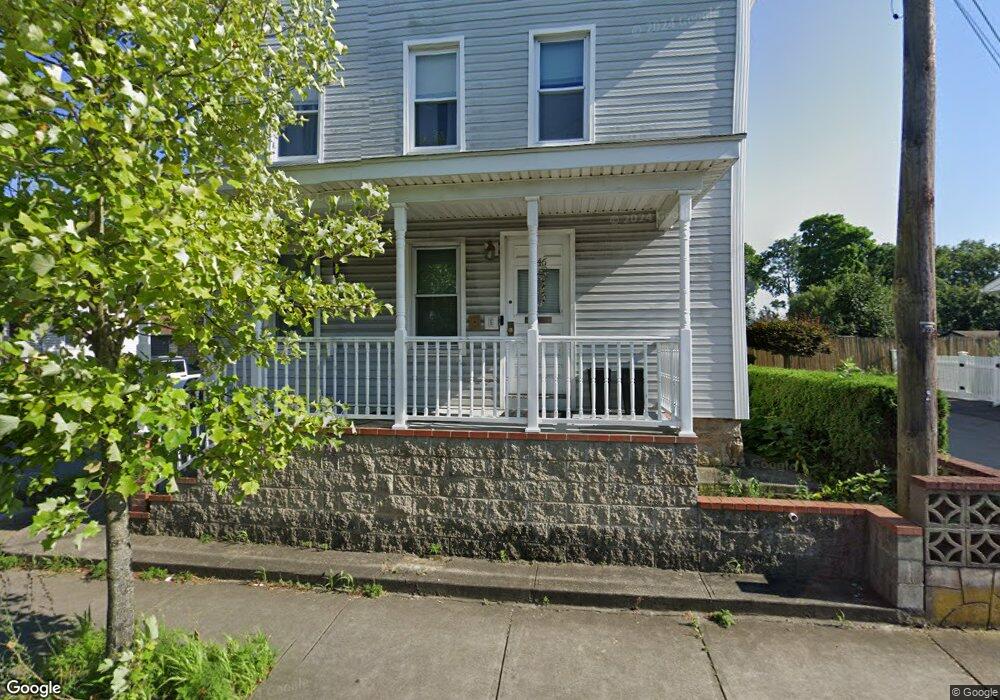
446 Allen St New Bedford, MA 02740
The South End NeighborhoodEstimated Value: $498,000 - $603,000
6
Beds
3
Baths
2,202
Sq Ft
$246/Sq Ft
Est. Value
About This Home
This home is located at 446 Allen St, New Bedford, MA 02740 and is currently estimated at $540,667, approximately $245 per square foot. 446 Allen St is a home located in Bristol County with nearby schools including Betsey B. Winslow Elementary School, Keith Middle School, and New Bedford High School.
Ownership History
Date
Name
Owned For
Owner Type
Purchase Details
Closed on
May 5, 2011
Sold by
Parsian Llc
Bought by
Maknooni Genuine G and Maknooni Hamid G
Current Estimated Value
Home Financials for this Owner
Home Financials are based on the most recent Mortgage that was taken out on this home.
Original Mortgage
$174,300
Outstanding Balance
$120,364
Interest Rate
4.82%
Mortgage Type
Purchase Money Mortgage
Estimated Equity
$420,303
Purchase Details
Closed on
Dec 7, 2009
Sold by
Aurora Loan Servicss L
Bought by
Parsian Llc
Purchase Details
Closed on
Apr 15, 2009
Sold by
Deoliveira Cecilia and Aurora Loan Svcs Llc
Bought by
Aurora Loan Svcs Llc
Purchase Details
Closed on
Oct 24, 2005
Sold by
Evelyn Danis T
Bought by
Deoliveira Cecilia
Create a Home Valuation Report for This Property
The Home Valuation Report is an in-depth analysis detailing your home's value as well as a comparison with similar homes in the area
Home Values in the Area
Average Home Value in this Area
Purchase History
| Date | Buyer | Sale Price | Title Company |
|---|---|---|---|
| Maknooni Genuine G | -- | -- | |
| Maknooni Genuine G | -- | -- | |
| Parsian Llc | $82,000 | -- | |
| Parsian Llc | $82,000 | -- | |
| Aurora Loan Svcs Llc | $206,800 | -- | |
| Aurora Loan Svcs Llc | $206,800 | -- | |
| Deoliveira Cecilia | $260,000 | -- | |
| Deoliveira Cecilia | $260,000 | -- |
Source: Public Records
Mortgage History
| Date | Status | Borrower | Loan Amount |
|---|---|---|---|
| Open | Deoliveira Cecilia | $174,300 | |
| Closed | Deoliveira Cecilia | $174,300 |
Source: Public Records
Tax History Compared to Growth
Tax History
| Year | Tax Paid | Tax Assessment Tax Assessment Total Assessment is a certain percentage of the fair market value that is determined by local assessors to be the total taxable value of land and additions on the property. | Land | Improvement |
|---|---|---|---|---|
| 2025 | $5,281 | $466,900 | $88,600 | $378,300 |
| 2024 | $4,736 | $394,700 | $90,000 | $304,700 |
| 2023 | $4,547 | $318,200 | $77,600 | $240,600 |
| 2022 | $4,081 | $262,600 | $73,800 | $188,800 |
| 2021 | $3,994 | $256,200 | $73,800 | $182,400 |
| 2020 | $3,933 | $243,400 | $73,800 | $169,600 |
| 2019 | $3,449 | $209,400 | $73,800 | $135,600 |
| 2018 | $3,250 | $195,400 | $73,800 | $121,600 |
| 2017 | $2,989 | $179,100 | $73,800 | $105,300 |
| 2016 | $2,892 | $175,400 | $73,800 | $101,600 |
| 2015 | $2,706 | $172,000 | $73,800 | $98,200 |
| 2014 | $2,541 | $167,600 | $69,400 | $98,200 |
Source: Public Records
Map
Nearby Homes