Estimated Value: $689,693 - $721,000
3
Beds
2
Baths
1,599
Sq Ft
$445/Sq Ft
Est. Value
About This Home
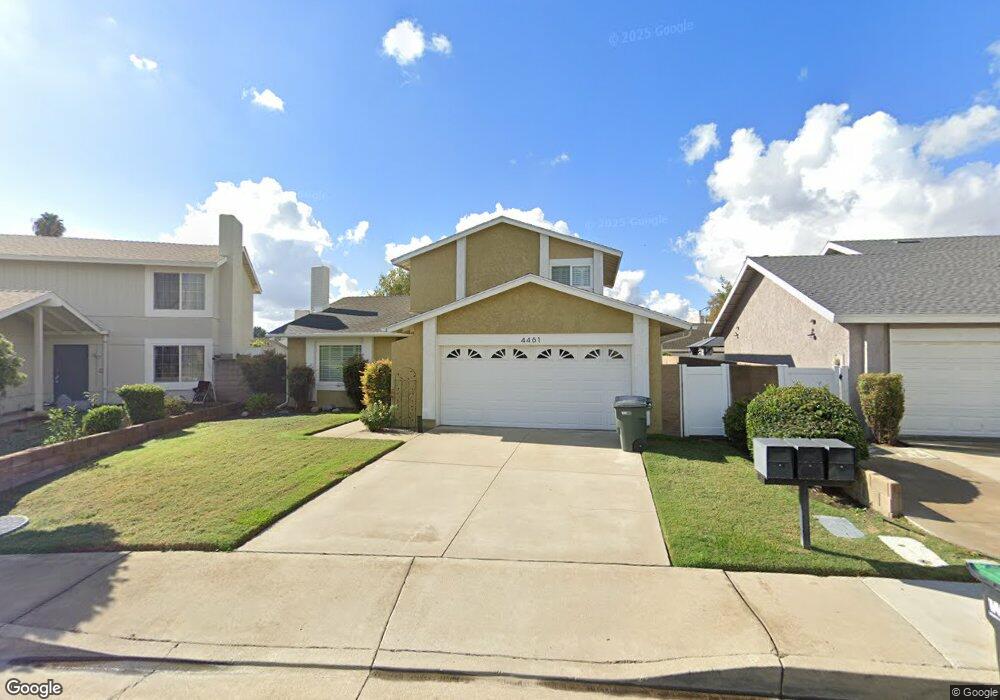
This home is located at 4461 Dahlia Rd, Chino, CA 91710 and is currently estimated at $710,923, approximately $444 per square foot. 4461 Dahlia Rd is a home located in San Bernardino County with nearby schools including Dickson Elementary, Ramona Junior High School, and Don Antonio Lugo High School.
Ownership History
Date
Name
Owned For
Owner Type
Purchase Details
Closed on
Sep 5, 2003
Sold by
Nelson Candy E
Bought by
Nelson Candy E and Candy E Nelson 1997 Revocable
Current Estimated Value
Purchase Details
Closed on
Jul 31, 2002
Sold by
Nelson Candy E
Bought by
Nelson Candy E
Home Financials for this Owner
Home Financials are based on the most recent Mortgage that was taken out on this home.
Original Mortgage
$92,400
Interest Rate
6.51%
Purchase Details
Closed on
Jul 29, 1997
Sold by
Bauer Candy E and Bauer Candy E
Bought by
Nelson Candy E and Candy E Nelson 1997 Revocable
Purchase Details
Closed on
Aug 24, 1993
Sold by
Bauer Gerald L
Bought by
Bauer Candy E
Home Financials for this Owner
Home Financials are based on the most recent Mortgage that was taken out on this home.
Original Mortgage
$90,000
Interest Rate
6.94%
Create a Home Valuation Report for This Property
The Home Valuation Report is an in-depth analysis detailing your home's value as well as a comparison with similar homes in the area
Home Values in the Area
Average Home Value in this Area
Purchase History
| Date | Buyer | Sale Price | Title Company |
|---|---|---|---|
| Nelson Candy E | -- | -- | |
| Nelson Candy E | -- | Commonwealth Land Title Co | |
| Nelson Candy E | -- | -- | |
| Bauer Candy E | -- | First American Title Insuran |
Source: Public Records
Mortgage History
| Date | Status | Borrower | Loan Amount |
|---|---|---|---|
| Closed | Nelson Candy E | $92,400 | |
| Previous Owner | Bauer Candy E | $90,000 |
Source: Public Records
Tax History Compared to Growth
Tax History
| Year | Tax Paid | Tax Assessment Tax Assessment Total Assessment is a certain percentage of the fair market value that is determined by local assessors to be the total taxable value of land and additions on the property. | Land | Improvement |
|---|---|---|---|---|
| 2025 | $1,433 | $137,074 | $17,506 | $119,568 |
| 2024 | $1,433 | $134,387 | $17,163 | $117,224 |
| 2023 | $1,392 | $131,751 | $16,826 | $114,925 |
| 2022 | $1,382 | $129,168 | $16,496 | $112,672 |
| 2021 | $1,354 | $126,636 | $16,173 | $110,463 |
| 2020 | $1,336 | $125,337 | $16,007 | $109,330 |
| 2019 | $1,311 | $122,879 | $15,693 | $107,186 |
| 2018 | $1,281 | $120,469 | $15,385 | $105,084 |
| 2017 | $1,257 | $118,107 | $15,083 | $103,024 |
| 2016 | $1,175 | $115,791 | $14,787 | $101,004 |
| 2015 | $1,150 | $114,052 | $14,565 | $99,487 |
| 2014 | $1,127 | $111,818 | $14,280 | $97,538 |
Source: Public Records
Map
Nearby Homes
- 13401 Wisteria Place
- 13640 Norton Ave
- 4621 Chino Ave
- 13358 Yorba Ave
- 4449 Carmen St
- 4539 Carmen St
- 4440 Carmen St
- 4912 G St
- 12958 Boston Ave
- 3947 Jose Ct
- 13115 Monte Vista Ave
- 13123 2nd St
- 13116 3rd St
- 13798 Roswell Ave
- 12940 4th St
- 4862 Lincoln Ave
- 12939 5th St
- 12540 Ramona Ave
- 3516 Larkwood Dr
- 3778 Pilgrims Way
- 4453 Dahlia Rd
- 4469 Dahlia Rd
- 13505 Daisy Ln
- 4477 Dahlia Rd
- 13513 Daisy Ln
- 13512 Calico Place
- 13468 Wisteria Place
- 13520 Calico Place
- 13507 Calico Place
- 4485 Dahlia Rd
- 13521 Daisy Ln
- 13468 Daisy Ln
- 13476 Daisy Ln
- 13484 Daisy Ln
- 4446 Dahlia Rd
- 13492 Daisy Ln
- 13500 Daisy Ln
- 13460 Wisteria Place
- 13508 Daisy Ln
- 4493 Dahlia Rd