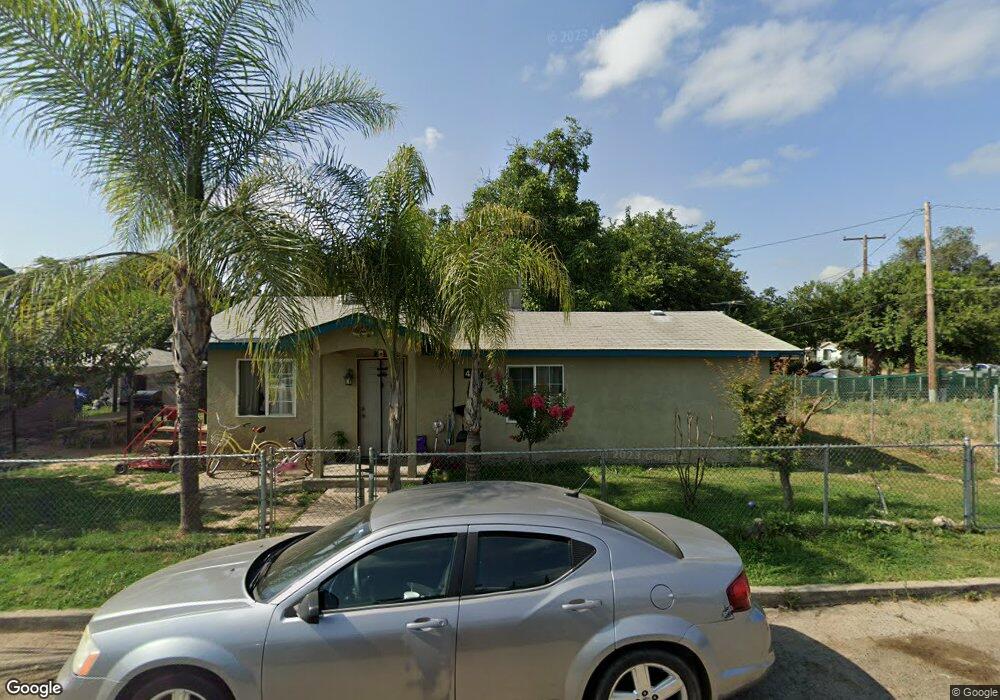
447 E Sycamore St Farmersville, CA 93223
Estimated Value: $180,000 - $259,000
3
Beds
1
Bath
931
Sq Ft
$235/Sq Ft
Est. Value
About This Home
This home is located at 447 E Sycamore St, Farmersville, CA 93223 and is currently estimated at $218,427, approximately $234 per square foot. 447 E Sycamore St is a home located in Tulare County with nearby schools including George L. Snowden Elementary School, J.E. Hester Elementary School, and Freedom Elementary School.
Ownership History
Date
Name
Owned For
Owner Type
Purchase Details
Closed on
Apr 3, 2020
Sold by
Jurado Olivia
Bought by
Jurado Manuel A and Nunez Sandra
Current Estimated Value
Purchase Details
Closed on
Apr 15, 2017
Sold by
Campos Ramon Nunez
Bought by
Jurado Olivia
Purchase Details
Closed on
Jul 10, 2015
Sold by
Jurado Olivia
Bought by
Campos Ramon Nunez and Jurado Olivia
Purchase Details
Closed on
Sep 19, 2014
Sold by
Solis Rigoberto
Bought by
Jurado Olivia
Purchase Details
Closed on
May 19, 1998
Sold by
Carvalho Mary L
Bought by
Solis Rigoberto and Solis Olivia
Purchase Details
Closed on
Sep 10, 1997
Sold by
Younger L D
Bought by
Carvalho Mary L
Home Financials for this Owner
Home Financials are based on the most recent Mortgage that was taken out on this home.
Original Mortgage
$38,000
Interest Rate
7.44%
Mortgage Type
Seller Take Back
Purchase Details
Closed on
Sep 21, 1995
Sold by
Barrera Moises
Bought by
Younger L D and Jones Clifford
Create a Home Valuation Report for This Property
The Home Valuation Report is an in-depth analysis detailing your home's value as well as a comparison with similar homes in the area
Home Values in the Area
Average Home Value in this Area
Purchase History
| Date | Buyer | Sale Price | Title Company |
|---|---|---|---|
| Jurado Manuel A | -- | None Available | |
| Jurado Olivia | -- | None Available | |
| Campos Ramon Nunez | -- | None Available | |
| Jurado Olivia | -- | None Available | |
| Solis Rigoberto | -- | Fidelity National Title Co | |
| Carvalho Mary L | $45,000 | First American Title Ins Co | |
| Younger L D | $39,056 | Old Republic Title Company |
Source: Public Records
Mortgage History
| Date | Status | Borrower | Loan Amount |
|---|---|---|---|
| Previous Owner | Carvalho Mary L | $38,000 |
Source: Public Records
Tax History Compared to Growth
Tax History
| Year | Tax Paid | Tax Assessment Tax Assessment Total Assessment is a certain percentage of the fair market value that is determined by local assessors to be the total taxable value of land and additions on the property. | Land | Improvement |
|---|---|---|---|---|
| 2025 | $719 | $63,488 | $39,190 | $24,298 |
| 2024 | $719 | $62,244 | $38,422 | $23,822 |
| 2023 | $720 | $61,024 | $37,669 | $23,355 |
| 2022 | $667 | $59,829 | $36,931 | $22,898 |
| 2021 | $655 | $58,656 | $36,207 | $22,449 |
| 2020 | $683 | $62,926 | $35,836 | $27,090 |
| 2019 | $696 | $61,692 | $35,133 | $26,559 |
| 2018 | $684 | $60,482 | $34,444 | $26,038 |
| 2017 | $684 | $59,296 | $33,769 | $25,527 |
| 2016 | $654 | $58,133 | $33,107 | $25,026 |
| 2015 | -- | $59,354 | $32,613 | $26,741 |
| 2014 | -- | $58,191 | $31,974 | $26,217 |
Source: Public Records
Map
Nearby Homes
- 528 S Camelia Ave
- 209 S Magnolia Ave
- 327 S Farmersville Blvd
- 680 E Larry St
- 738 E Larry St
- 245 W Oakland St
- 438 N Magnolia Ave
- 885 E Ash St
- 903 E Ash St
- 701 Farmersville Rd
- 732 N Dwight Ave
- 896 Farmersville Rd
- 0 S Farmersville Blvd Unit 238390
- 753 N Brundage Ave
- 322 E Citrus Dr
- 188 E Citrus Dr
- 896 N Mariposa Ave
- 0 Avenue 288
- 1643 Tehama Ave
- 0 Avenue 288
- 302 S Rose Ave
- 312 S Rose Ave
- 330 S Rose Ave
- 248 S Rose Ave
- 442 E Sycamore St
- 238 S Rose Ave
- 218 S Rose Ave
- 233 S Rose Ave
- 380 S Rose Ave
- 335 S Rose Ave
- 365 E Sycamore St
- 309 S Rose Ave
- 396 S Rose Ave
- 366 E Sycamore St
- 359 S Rose Ave
- 332 E Sycamore St
- 424 S Rose Ave
- 440 E Oakland St
- 385 S Rose Ave
- 422 E Oakland St