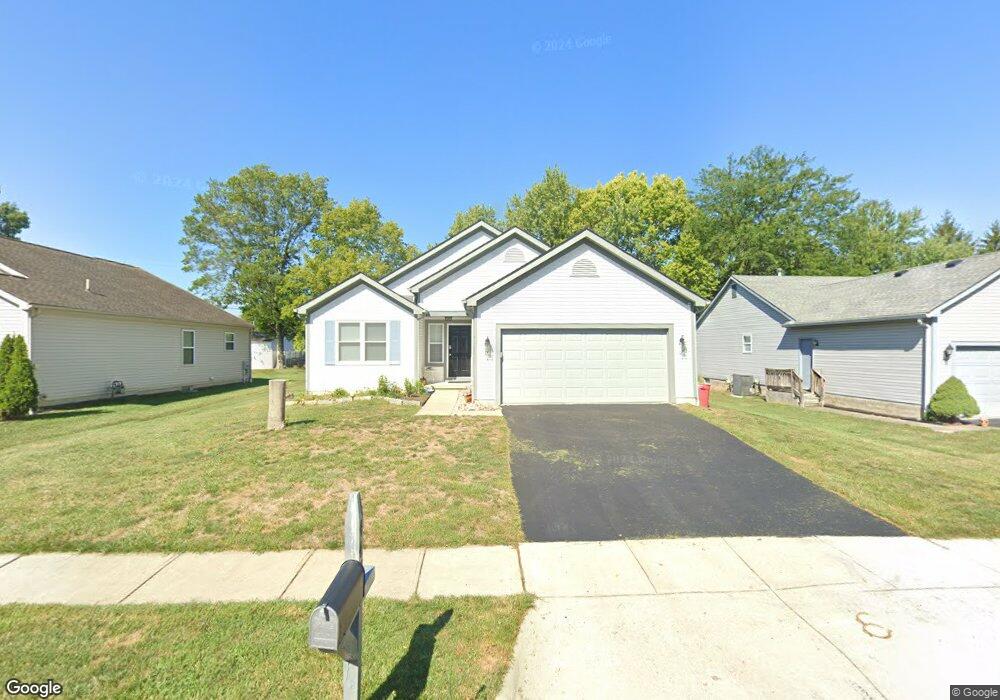
447 Tallman St Groveport, OH 43125
Estimated Value: $250,000 - $314,000
3
Beds
2
Baths
1,440
Sq Ft
$192/Sq Ft
Est. Value
About This Home
This home is located at 447 Tallman St, Groveport, OH 43125 and is currently estimated at $276,638, approximately $192 per square foot. 447 Tallman St is a home located in Franklin County with nearby schools including Groveport Madison High School, Groveport Community School, and Madison Christian School.
Ownership History
Date
Name
Owned For
Owner Type
Purchase Details
Closed on
May 17, 2004
Sold by
Cahill Rocio D
Bought by
Cahill James E
Current Estimated Value
Purchase Details
Closed on
Jul 24, 2003
Sold by
Cahill James E
Bought by
Cahill James E and Cahill Rocio D
Purchase Details
Closed on
Sep 3, 2002
Sold by
Cahill Rocio D
Bought by
Cahill James E
Purchase Details
Closed on
Oct 27, 2000
Sold by
M/I Schottenstein Homes Inc
Bought by
Cahill James E and Cahill Rocio D
Home Financials for this Owner
Home Financials are based on the most recent Mortgage that was taken out on this home.
Original Mortgage
$145,973
Interest Rate
7.96%
Mortgage Type
FHA
Create a Home Valuation Report for This Property
The Home Valuation Report is an in-depth analysis detailing your home's value as well as a comparison with similar homes in the area
Home Values in the Area
Average Home Value in this Area
Purchase History
| Date | Buyer | Sale Price | Title Company |
|---|---|---|---|
| Cahill James E | -- | Ohio Title | |
| Cahill James E | -- | Christopher Land Title Inc | |
| Cahill James E | -- | Ohio Title | |
| Cahill James E | $147,900 | Transohio Residential Title |
Source: Public Records
Mortgage History
| Date | Status | Borrower | Loan Amount |
|---|---|---|---|
| Closed | Cahill James E | $145,973 |
Source: Public Records
Tax History Compared to Growth
Tax History
| Year | Tax Paid | Tax Assessment Tax Assessment Total Assessment is a certain percentage of the fair market value that is determined by local assessors to be the total taxable value of land and additions on the property. | Land | Improvement |
|---|---|---|---|---|
| 2024 | $4,112 | $84,080 | $23,280 | $60,800 |
| 2023 | $4,076 | $84,070 | $23,275 | $60,795 |
| 2022 | $3,218 | $52,960 | $9,590 | $43,370 |
| 2021 | $3,230 | $52,960 | $9,590 | $43,370 |
| 2020 | $3,237 | $52,960 | $9,590 | $43,370 |
| 2019 | $3,012 | $43,440 | $7,980 | $35,460 |
| 2018 | $3,194 | $43,440 | $7,980 | $35,460 |
| 2017 | $3,036 | $43,440 | $7,980 | $35,460 |
| 2016 | $3,329 | $43,260 | $7,840 | $35,420 |
| 2015 | $3,359 | $43,260 | $7,840 | $35,420 |
| 2014 | $3,162 | $43,260 | $7,840 | $35,420 |
| 2013 | $1,419 | $45,535 | $8,260 | $37,275 |
Source: Public Records
Map
Nearby Homes