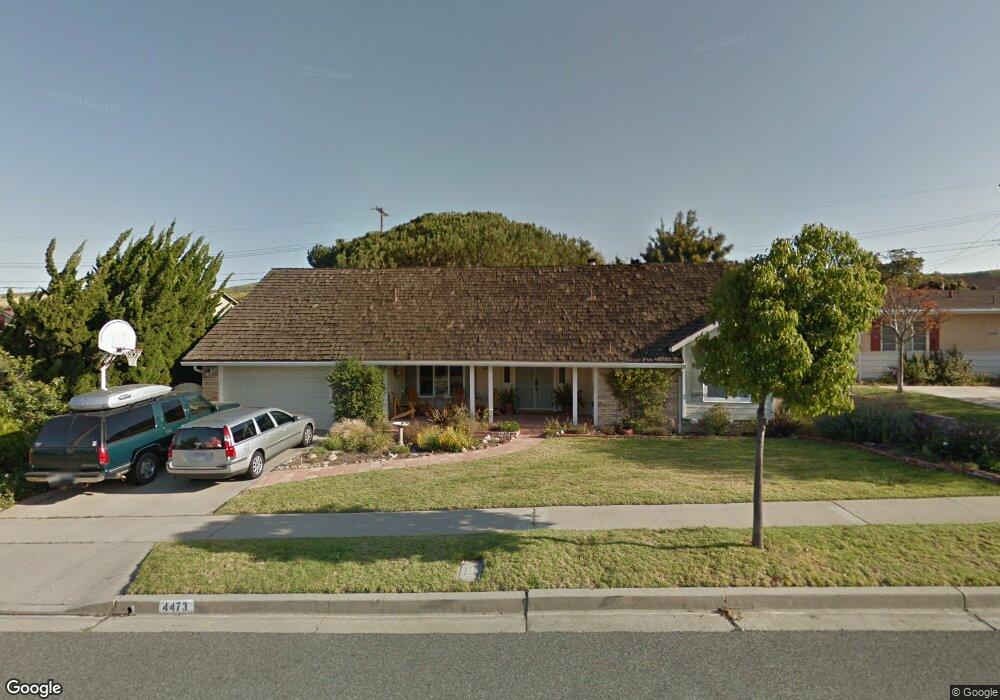
4473 Sweetbriar St Ventura, CA 93003
College NeighborhoodEstimated Value: $1,189,000 - $1,364,000
3
Beds
3
Baths
1,890
Sq Ft
$686/Sq Ft
Est. Value
About This Home
This home is located at 4473 Sweetbriar St, Ventura, CA 93003 and is currently estimated at $1,296,457, approximately $685 per square foot. 4473 Sweetbriar St is a home located in Ventura County with nearby schools including Loma Vista Elementary School, Cabrillo Middle School, and Ventura High School.
Ownership History
Date
Name
Owned For
Owner Type
Purchase Details
Closed on
Jul 9, 2012
Sold by
Fountain Paul Scott and Fountain Lynne Marie
Bought by
Fountain Paul Scott and Fountain Lynne Marie
Current Estimated Value
Purchase Details
Closed on
Apr 3, 2002
Sold by
Oconnor Matthew M and Oconnor Laurel F
Bought by
Fountain Paul S and Fountain Lynne M
Home Financials for this Owner
Home Financials are based on the most recent Mortgage that was taken out on this home.
Original Mortgage
$294,000
Interest Rate
6.78%
Mortgage Type
Balloon
Purchase Details
Closed on
Oct 11, 1999
Sold by
Romero Paul A Alice B
Bought by
Oconnor Matthew M and Oconnor Laurel F
Home Financials for this Owner
Home Financials are based on the most recent Mortgage that was taken out on this home.
Original Mortgage
$295,000
Interest Rate
7.12%
Purchase Details
Closed on
May 3, 1994
Sold by
Romero Paul A and Romero Alice B
Bought by
Romero Paul A and Romero Alice B
Create a Home Valuation Report for This Property
The Home Valuation Report is an in-depth analysis detailing your home's value as well as a comparison with similar homes in the area
Home Values in the Area
Average Home Value in this Area
Purchase History
| Date | Buyer | Sale Price | Title Company |
|---|---|---|---|
| Fountain Paul Scott | -- | None Available | |
| Fountain Paul S | $487,500 | First American Title Ins Co | |
| Oconnor Matthew M | $380,000 | Gateway Title | |
| Romero Paul A | -- | -- |
Source: Public Records
Mortgage History
| Date | Status | Borrower | Loan Amount |
|---|---|---|---|
| Closed | Fountain Paul S | $294,000 | |
| Previous Owner | Oconnor Matthew M | $295,000 | |
| Closed | Oconnor Matthew M | $66,000 |
Source: Public Records
Tax History Compared to Growth
Tax History
| Year | Tax Paid | Tax Assessment Tax Assessment Total Assessment is a certain percentage of the fair market value that is determined by local assessors to be the total taxable value of land and additions on the property. | Land | Improvement |
|---|---|---|---|---|
| 2025 | $7,772 | $720,160 | $288,061 | $432,099 |
| 2024 | $7,772 | $706,040 | $282,413 | $423,627 |
| 2023 | $7,685 | $692,197 | $276,876 | $415,321 |
| 2022 | $7,143 | $678,625 | $271,447 | $407,178 |
| 2021 | $7,021 | $665,319 | $266,124 | $399,195 |
| 2020 | $6,957 | $658,499 | $263,397 | $395,102 |
| 2019 | $6,831 | $645,588 | $258,233 | $387,355 |
| 2018 | $6,717 | $632,930 | $253,170 | $379,760 |
| 2017 | $6,594 | $620,520 | $248,206 | $372,314 |
| 2016 | $6,479 | $608,354 | $243,340 | $365,014 |
| 2015 | $6,375 | $599,218 | $239,686 | $359,532 |
| 2014 | $6,285 | $587,483 | $234,992 | $352,491 |
Source: Public Records
Map
Nearby Homes
- 4205 Foothill Rd
- 287 Oberlin Ave
- 4797 Loma Vista Rd
- 4857 Loma Vista Rd
- 412 Dayloma Ave
- 251 Palomares Ave
- 4432 Westmont St
- 339 Carol Dr
- 3750 Mound Ave
- 33 Glen Ellen Dr
- 275 Fairfax Ave
- 4700 Aurora Dr Unit 16
- 4700 Aurora Dr Unit 75
- 4700 Aurora Dr Unit 29
- 114 San Marino Ave
- 288 Byron Ave
- 572 Skyline Rd
- 262 Crestwood Ave
- 5438 Rainier St
- 3302 San Luis St
- 4451 Sweetbriar St
- 4479 Sweetbriar St
- 4424 Pomona St
- 4402 Pomona St
- 4448 Pomona St
- 4474 Sweetbriar St
- 4483 Sweetbriar St
- 4452 Sweetbriar St
- 4482 Sweetbriar St
- 4392 Pomona St
- 4472 Pomona St
- 4430 Sweetbriar St
- 4488 Sweetbriar St
- 4407 Sweetbriar St
- 4495 Sweetbriar St
- 4384 Pomona St
- 4425 Pomona St
- 4496 Pomona St
- 4401 Pomona St
- 4471 Hope St