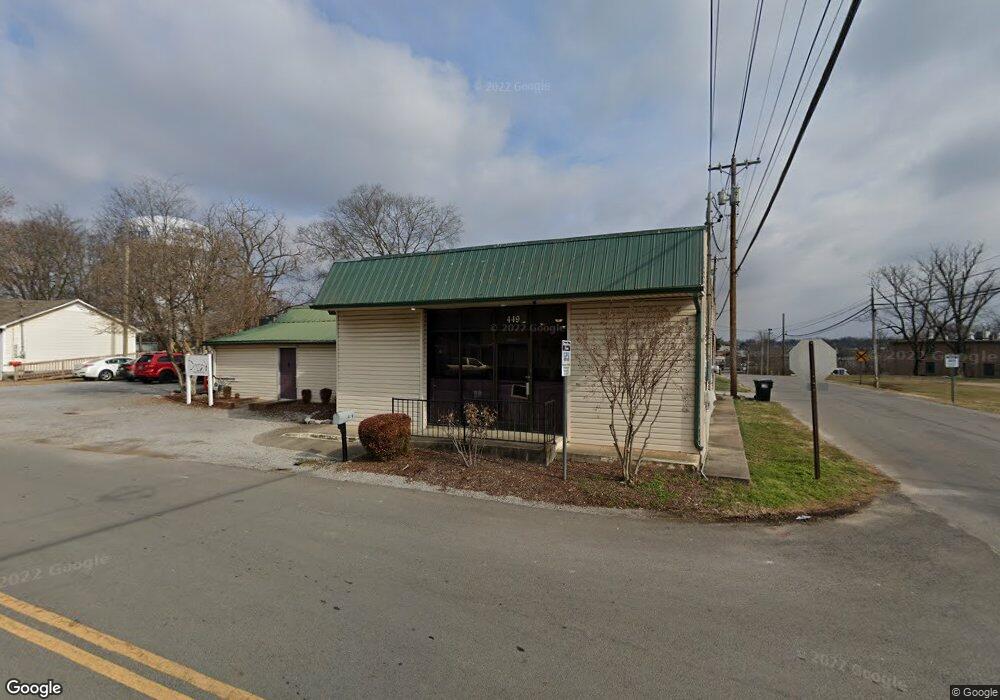
449 S Kings Hwy Murfreesboro, TN 37129
Estimated Value: $231,510
--
Bed
1
Bath
3,000
Sq Ft
$77/Sq Ft
Est. Value
About This Home
This home is located at 449 S Kings Hwy, Murfreesboro, TN 37129 and is currently estimated at $231,510, approximately $77 per square foot. 449 S Kings Hwy is a home located in Rutherford County with nearby schools including Mitchell-Neilson Elementary, Rockvale Middle School, and Rockvale High School.
Ownership History
Date
Name
Owned For
Owner Type
Purchase Details
Closed on
Oct 31, 2022
Sold by
Swanson Developments Lp
Bought by
Helpiong Hands General Contracting
Current Estimated Value
Home Financials for this Owner
Home Financials are based on the most recent Mortgage that was taken out on this home.
Original Mortgage
$176,000
Outstanding Balance
$169,547
Interest Rate
6.02%
Mortgage Type
New Conventional
Estimated Equity
$61,963
Create a Home Valuation Report for This Property
The Home Valuation Report is an in-depth analysis detailing your home's value as well as a comparison with similar homes in the area
Home Values in the Area
Average Home Value in this Area
Purchase History
| Date | Buyer | Sale Price | Title Company |
|---|---|---|---|
| Helpiong Hands General Contracting | $220,000 | Hywater Title |
Source: Public Records
Mortgage History
| Date | Status | Borrower | Loan Amount |
|---|---|---|---|
| Open | Helpiong Hands General Contracting | $176,000 |
Source: Public Records
Tax History Compared to Growth
Tax History
| Year | Tax Paid | Tax Assessment Tax Assessment Total Assessment is a certain percentage of the fair market value that is determined by local assessors to be the total taxable value of land and additions on the property. | Land | Improvement |
|---|---|---|---|---|
| 2025 | $1,389 | $49,080 | $23,920 | $25,160 |
| 2024 | $1,389 | $49,080 | $23,920 | $25,160 |
| 2023 | $921 | $49,080 | $23,920 | $25,160 |
| 2022 | $793 | $52,480 | $27,320 | $25,160 |
| 2021 | $917 | $41,320 | $20,720 | $20,600 |
| 2020 | $917 | $41,320 | $20,720 | $20,600 |
| 2019 | $917 | $41,320 | $20,720 | $20,600 |
| 2018 | $1,259 | $41,320 | $0 | $0 |
| 2017 | $1,362 | $35,040 | $0 | $0 |
| 2016 | $1,362 | $35,040 | $0 | $0 |
| 2015 | $1,362 | $35,040 | $0 | $0 |
| 2014 | $871 | $35,040 | $0 | $0 |
| 2013 | -- | $30,200 | $0 | $0 |
Source: Public Records
Map
Nearby Homes
- 728 Old Salem Rd
- 105 Battle Ave
- 420 E State St
- 431 E Castle St
- 225 N Academy St
- 401 E Main St
- 406 S Highland Ave
- 412 N Church St
- 530 E State St
- 503 N Spring St
- 422 N Academy St
- 515 N Spring St
- 406 S University St
- 1118 Houston Dr
- 1103 Virginia Ave
- 923 SE Broad St Unit 4
- 114 S Hancock St
- 717 N Church St
- 804 N Academy St
- 1006 Jones Blvd
- 622 Old Salem Rd
- 620 Old Salem Rd
- 445 S Kings Hwy
- 442 S Kings Hwy
- 618 Old Salem Rd
- 441 S Kings Hwy
- 436 Mill St
- 636 Old Salem Rd
- 614 Old Salem Rd
- 436 S Kings Hwy
- 439 S Kings Hwy
- 432 Mill St
- 432 S Kings Hwy
- 430 Mill St
- 437 S Kings Hwy
- 608 Old Salem Rd
- 445 Battle Ave
- 441 Battle Ave
- 428 S Kings Hwy
- 426 Mill St