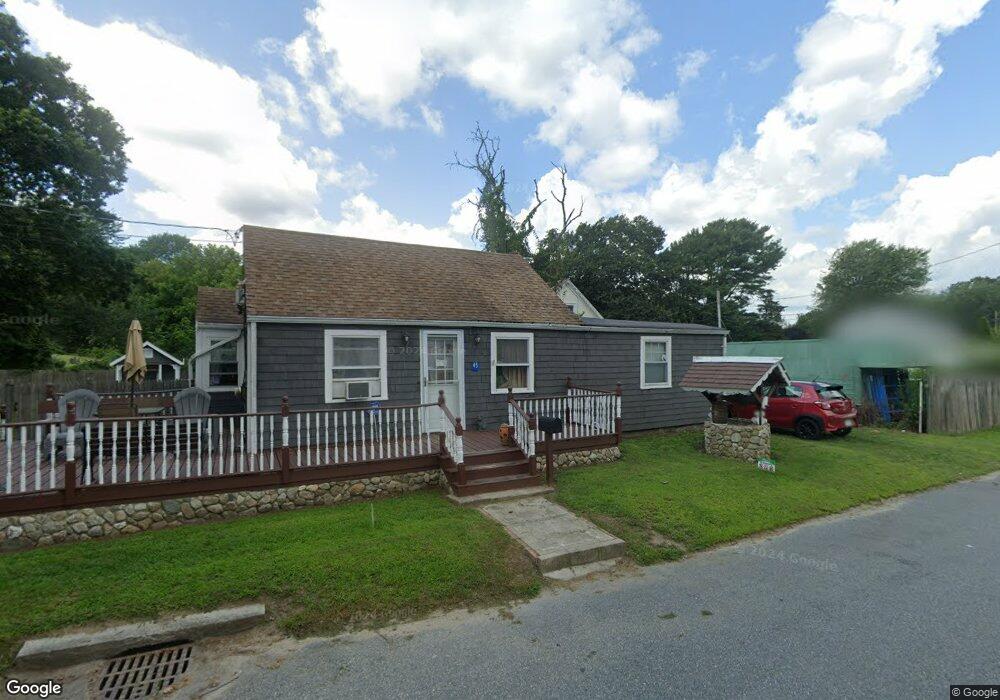
45 Boylston St Acushnet, MA 02743
Upper Acushnet NeighborhoodEstimated Value: $312,000 - $383,000
4
Beds
1
Bath
1,011
Sq Ft
$341/Sq Ft
Est. Value
About This Home
This home is located at 45 Boylston St, Acushnet, MA 02743 and is currently estimated at $344,479, approximately $340 per square foot. 45 Boylston St is a home located in Bristol County with nearby schools including Acushnet Elementary School, Albert F Ford Middle School, and Alma Del Mar Charter School.
Ownership History
Date
Name
Owned For
Owner Type
Purchase Details
Closed on
Oct 12, 2021
Sold by
Int Elaine Brienzo
Bought by
Elaine Brienzo Lt
Current Estimated Value
Purchase Details
Closed on
Aug 31, 1989
Sold by
Ferreira Yvette M
Bought by
Ferreira Elaine
Home Financials for this Owner
Home Financials are based on the most recent Mortgage that was taken out on this home.
Original Mortgage
$40,000
Interest Rate
9.7%
Mortgage Type
Purchase Money Mortgage
Create a Home Valuation Report for This Property
The Home Valuation Report is an in-depth analysis detailing your home's value as well as a comparison with similar homes in the area
Home Values in the Area
Average Home Value in this Area
Purchase History
| Date | Buyer | Sale Price | Title Company |
|---|---|---|---|
| Elaine Brienzo Lt | -- | None Available | |
| Ferreira Elaine | $50,000 | -- |
Source: Public Records
Mortgage History
| Date | Status | Borrower | Loan Amount |
|---|---|---|---|
| Previous Owner | Ferreira Elaine | $40,000 |
Source: Public Records
Tax History Compared to Growth
Tax History
| Year | Tax Paid | Tax Assessment Tax Assessment Total Assessment is a certain percentage of the fair market value that is determined by local assessors to be the total taxable value of land and additions on the property. | Land | Improvement |
|---|---|---|---|---|
| 2025 | $30 | $278,100 | $90,100 | $188,000 |
| 2024 | $2,928 | $256,600 | $85,900 | $170,700 |
| 2023 | $2,932 | $244,300 | $77,500 | $166,800 |
| 2022 | $2,898 | $218,400 | $73,300 | $145,100 |
| 2021 | $2,686 | $194,200 | $73,300 | $120,900 |
| 2020 | $2,707 | $194,200 | $73,300 | $120,900 |
| 2019 | $3,078 | $176,100 | $64,900 | $111,200 |
| 2018 | $2,414 | $167,400 | $64,900 | $102,500 |
| 2017 | $2,322 | $160,800 | $64,900 | $95,900 |
| 2016 | $2,336 | $160,800 | $64,900 | $95,900 |
| 2015 | $2,141 | $149,900 | $64,900 | $85,000 |
Source: Public Records
Map
Nearby Homes