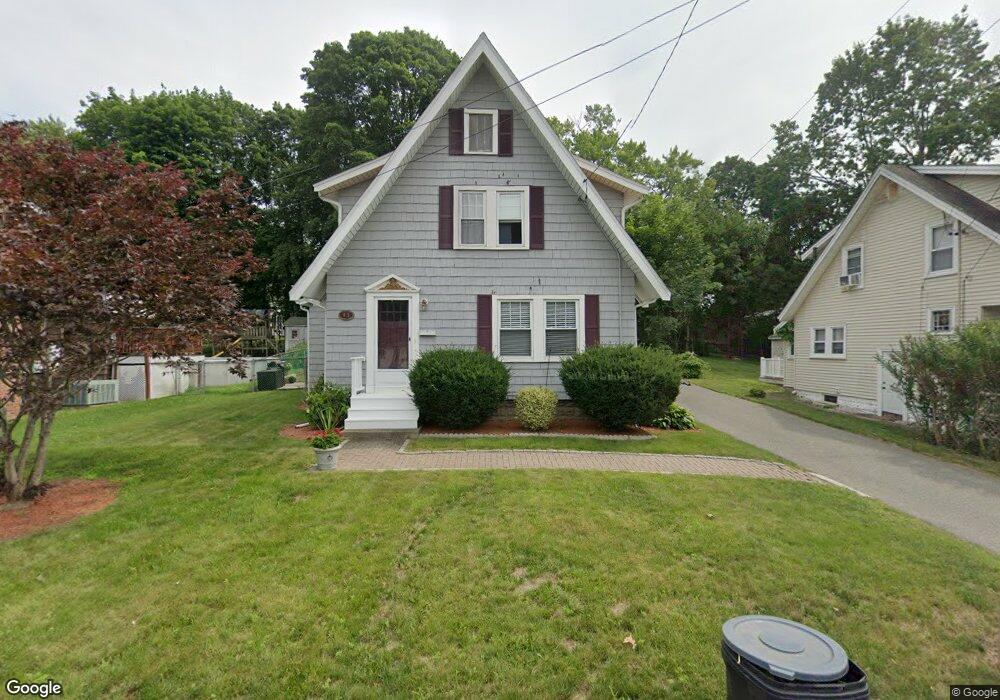
45 Cranberry Rd Weymouth, MA 02188
Weymouth Landing NeighborhoodEstimated Value: $536,816 - $579,000
--
Bed
2
Baths
1,152
Sq Ft
$489/Sq Ft
Est. Value
About This Home
This home is located at 45 Cranberry Rd, Weymouth, MA 02188 and is currently estimated at $563,204, approximately $488 per square foot. 45 Cranberry Rd is a home located in Norfolk County with nearby schools including Frederick C Murphy, Abigail Adams Middle School, and Weymouth Middle School Chapman.
Ownership History
Date
Name
Owned For
Owner Type
Purchase Details
Closed on
Mar 27, 1985
Bought by
Greene Roderick J and Greene Deborah L
Current Estimated Value
Create a Home Valuation Report for This Property
The Home Valuation Report is an in-depth analysis detailing your home's value as well as a comparison with similar homes in the area
Home Values in the Area
Average Home Value in this Area
Purchase History
| Date | Buyer | Sale Price | Title Company |
|---|---|---|---|
| Greene Roderick J | $100,000 | -- |
Source: Public Records
Mortgage History
| Date | Status | Borrower | Loan Amount |
|---|---|---|---|
| Closed | Greene Roderick J | $10,000 | |
| Closed | Greene Roderick J | $100,000 | |
| Closed | Greene Roderick J | $100,000 | |
| Closed | Greene Roderick J | $94,125 |
Source: Public Records
Tax History Compared to Growth
Tax History
| Year | Tax Paid | Tax Assessment Tax Assessment Total Assessment is a certain percentage of the fair market value that is determined by local assessors to be the total taxable value of land and additions on the property. | Land | Improvement |
|---|---|---|---|---|
| 2025 | $4,859 | $481,100 | $218,300 | $262,800 |
| 2024 | $4,708 | $458,400 | $207,900 | $250,500 |
| 2023 | $4,534 | $433,900 | $192,500 | $241,400 |
| 2022 | $4,436 | $387,100 | $178,300 | $208,800 |
| 2021 | $4,039 | $344,000 | $178,300 | $165,700 |
| 2020 | $3,833 | $321,600 | $178,300 | $143,300 |
| 2019 | $3,743 | $308,800 | $171,400 | $137,400 |
| 2018 | $3,635 | $290,800 | $163,200 | $127,600 |
| 2017 | $3,506 | $273,700 | $155,500 | $118,200 |
| 2016 | $3,369 | $263,200 | $149,500 | $113,700 |
| 2015 | $3,181 | $246,600 | $142,700 | $103,900 |
| 2014 | $3,052 | $229,500 | $132,800 | $96,700 |
Source: Public Records
Map
Nearby Homes
- 294 Commercial St
- 114 Broad St Unit D
- 114 Broad St Unit C
- 19 Vine St Unit 3
- 19 Vine St Unit 1
- 11 Richmond St
- 122 Washington St Unit 22
- 15 1st St
- 286 Broad St
- 23-25 Lindbergh Ave
- 38 Idlewell St
- 16 Lindbergh Ave
- 12 Klasson Ln
- 367 Essex St
- 36 Brookside Rd
- 286 Essex St
- 70 Biscayne Ave
- 76 Kingman St
- 15 Summer St
- 33 Congress St