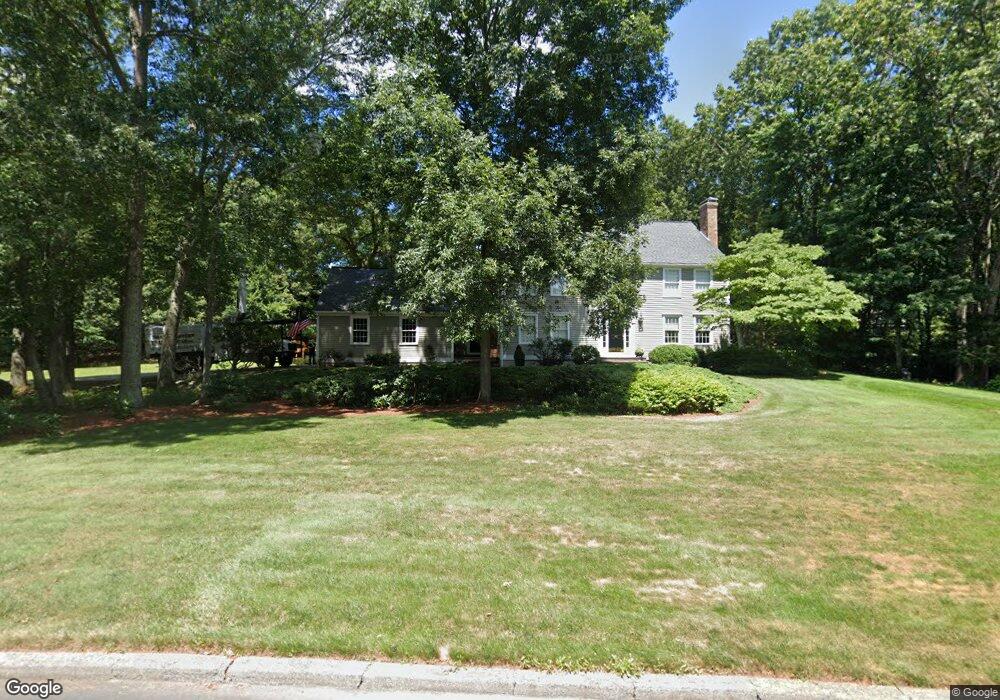
45 Fairway Dr Seekonk, MA 02771
Estimated Value: $929,008 - $1,044,000
3
Beds
3
Baths
2,925
Sq Ft
$336/Sq Ft
Est. Value
About This Home
This home is located at 45 Fairway Dr, Seekonk, MA 02771 and is currently estimated at $984,252, approximately $336 per square foot. 45 Fairway Dr is a home located in Bristol County with nearby schools including Seekonk High School, St Cecilia School, and Saint Teresa Catholic Elementary School.
Ownership History
Date
Name
Owned For
Owner Type
Purchase Details
Closed on
Nov 9, 2020
Sold by
Theroux Thomas A and Theroux Susan M
Bought by
Theroux Ft and Stanford
Current Estimated Value
Purchase Details
Closed on
Jan 1, 1985
Bought by
Theroux Thomas and Theroux Susan
Create a Home Valuation Report for This Property
The Home Valuation Report is an in-depth analysis detailing your home's value as well as a comparison with similar homes in the area
Home Values in the Area
Average Home Value in this Area
Purchase History
| Date | Buyer | Sale Price | Title Company |
|---|---|---|---|
| Theroux Ft | -- | None Available | |
| Theroux Thomas | -- | -- |
Source: Public Records
Mortgage History
| Date | Status | Borrower | Loan Amount |
|---|---|---|---|
| Previous Owner | Theroux Thomas | $150,000 | |
| Previous Owner | Theroux Thomas | $50,000 | |
| Previous Owner | Theroux Thomas | $95,000 |
Source: Public Records
Tax History Compared to Growth
Tax History
| Year | Tax Paid | Tax Assessment Tax Assessment Total Assessment is a certain percentage of the fair market value that is determined by local assessors to be the total taxable value of land and additions on the property. | Land | Improvement |
|---|---|---|---|---|
| 2025 | $10,378 | $840,300 | $194,800 | $645,500 |
| 2024 | $9,779 | $791,800 | $194,800 | $597,000 |
| 2023 | $9,574 | $730,300 | $178,700 | $551,600 |
| 2022 | $8,668 | $649,800 | $178,700 | $471,100 |
| 2021 | $8,407 | $619,500 | $157,900 | $461,600 |
| 2020 | $7,988 | $606,500 | $158,100 | $448,400 |
| 2019 | $7,696 | $589,300 | $158,100 | $431,200 |
| 2018 | $7,504 | $562,100 | $158,100 | $404,000 |
| 2017 | $7,344 | $545,600 | $159,800 | $385,800 |
| 2016 | $7,200 | $536,900 | $159,800 | $377,100 |
| 2015 | $6,997 | $528,900 | $159,800 | $369,100 |
Source: Public Records
Map
Nearby Homes