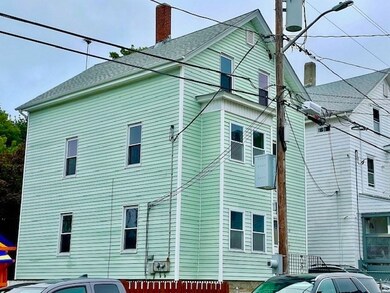
45 Garfield St Fall River, MA 02721
Maplewood NeighborhoodAbout This Home
As of March 2025Come discover this Prime investment opportunity, sold at around 200 dollars per square feet of rental Real Estate,this TWO Family is for the investor or buyer looking to use Rehab financing, but potential for future rental income for future rental income growth. The first floor interior needs renovations, Main unit, a potential 4 bedroom unit that is ready to be lived in. This property is being Sold AS IS, And May not be suitable for FHA or VA financing. THIS PROPERTY IS BEING DELIVERED TOTALLY VACANT
Property Details
Home Type
- Multi-Family
Est. Annual Taxes
- $3,717
Year Built
- Built in 1900
Lot Details
- 2,731 Sq Ft Lot
- Fenced
- Irregular Lot
Interior Spaces
- 1,929 Sq Ft Home
- Property has 1 Level
- Basement Fills Entire Space Under The House
Bedrooms and Bathrooms
- 5 Bedrooms
- 2 Full Bathrooms
Utilities
- 100 Amp Service
Community Details
- 2 Units
Listing and Financial Details
- Assessor Parcel Number M:0E02 B:0000 L:0066,2823030
Ownership History
Purchase Details
Home Financials for this Owner
Home Financials are based on the most recent Mortgage that was taken out on this home.Purchase Details
Similar Homes in Fall River, MA
Home Values in the Area
Average Home Value in this Area
Purchase History
| Date | Type | Sale Price | Title Company |
|---|---|---|---|
| Deed | $144,475 | -- | |
| Deed | $144,475 | -- | |
| Deed | $122,000 | -- | |
| Deed | $122,000 | -- |
Mortgage History
| Date | Status | Loan Amount | Loan Type |
|---|---|---|---|
| Open | $536,222 | FHA | |
| Closed | $536,222 | FHA | |
| Closed | $336,000 | Purchase Money Mortgage | |
| Closed | $188,800 | No Value Available | |
| Closed | $37,975 | No Value Available | |
| Closed | $143,342 | Purchase Money Mortgage |
Property History
| Date | Event | Price | Change | Sq Ft Price |
|---|---|---|---|---|
| 03/31/2025 03/31/25 | Sold | $565,000 | -2.6% | $309 / Sq Ft |
| 03/03/2025 03/03/25 | Pending | -- | -- | -- |
| 02/24/2025 02/24/25 | For Sale | $579,900 | +52.6% | $317 / Sq Ft |
| 09/10/2024 09/10/24 | Sold | $380,000 | -2.5% | $197 / Sq Ft |
| 08/06/2024 08/06/24 | Pending | -- | -- | -- |
| 07/31/2024 07/31/24 | For Sale | $389,900 | -- | $202 / Sq Ft |
Tax History Compared to Growth
Tax History
| Year | Tax Paid | Tax Assessment Tax Assessment Total Assessment is a certain percentage of the fair market value that is determined by local assessors to be the total taxable value of land and additions on the property. | Land | Improvement |
|---|---|---|---|---|
| 2025 | $4,049 | $353,600 | $122,600 | $231,000 |
| 2024 | $3,717 | $323,500 | $117,900 | $205,600 |
| 2023 | $3,371 | $274,700 | $101,100 | $173,600 |
| 2022 | $3,086 | $244,500 | $91,900 | $152,600 |
| 2021 | $2,860 | $206,800 | $85,000 | $121,800 |
| 2020 | $2,582 | $178,700 | $81,400 | $97,300 |
| 2019 | $2,432 | $166,800 | $77,500 | $89,300 |
| 2018 | $2,254 | $154,200 | $76,100 | $78,100 |
| 2017 | $2,118 | $151,300 | $77,600 | $73,700 |
| 2016 | $2,079 | $152,500 | $80,800 | $71,700 |
| 2015 | $1,955 | $149,500 | $77,800 | $71,700 |
| 2014 | $2,017 | $160,300 | $81,900 | $78,400 |
Agents Affiliated with this Home
-
Legacy Direct Realty Team

Seller's Agent in 2025
Legacy Direct Realty Team
RE/MAX
2 in this area
16 Total Sales
-
Jeffrey Touron

Seller Co-Listing Agent in 2025
Jeffrey Touron
RE/MAX
(774) 204-4283
1 in this area
60 Total Sales
-
Kathryn Tarlin

Buyer's Agent in 2025
Kathryn Tarlin
Berkshire Hathaway HomeServices Commonwealth Real Estate
(617) 429-0420
1 in this area
46 Total Sales
-
Kevin Proulx
K
Seller's Agent in 2024
Kevin Proulx
Amaral & Associates RE
(508) 989-1444
1 in this area
36 Total Sales
Map
Source: MLS Property Information Network (MLS PIN)
MLS Number: 73272008
APN: FALL-000002E-000000-000066


