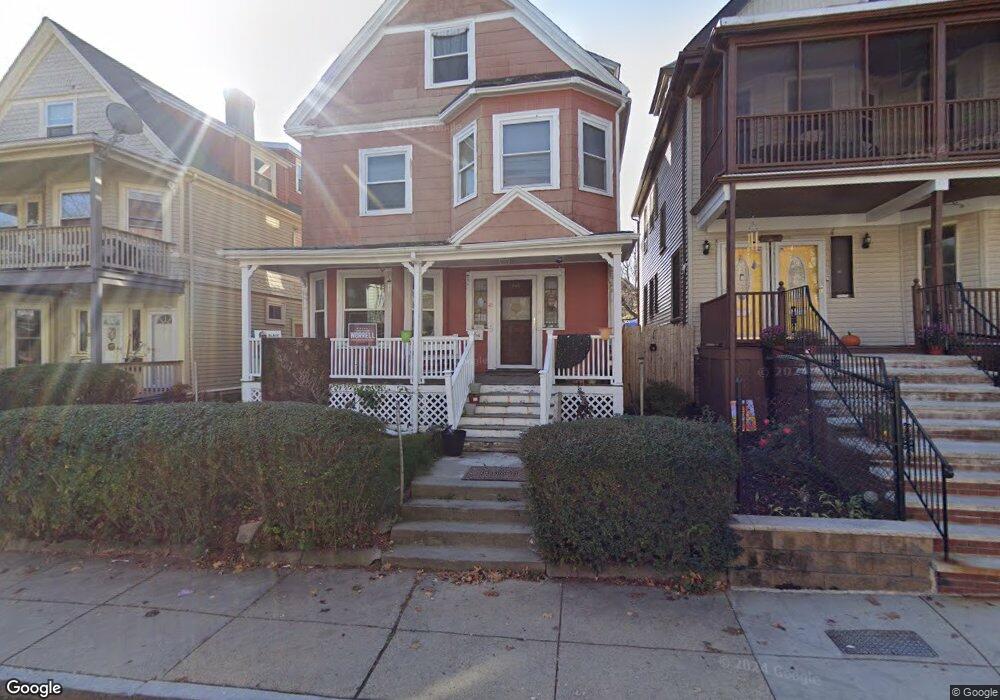
45 Holborn St Dorchester, MA 02121
Sav-Mor NeighborhoodEstimated Value: $469,000 - $694,000
6
Beds
2
Baths
2,786
Sq Ft
$208/Sq Ft
Est. Value
About This Home
This home is located at 45 Holborn St, Dorchester, MA 02121 and is currently estimated at $578,660, approximately $207 per square foot. 45 Holborn St is a home located in Suffolk County with nearby schools including Bridge Boston Charter School and Uncommon Schools Roxbury Prep Dorchester Campus.
Ownership History
Date
Name
Owned For
Owner Type
Purchase Details
Closed on
Nov 2, 2006
Sold by
Capdeville Emanuel G
Bought by
Herndon Kimberley
Current Estimated Value
Home Financials for this Owner
Home Financials are based on the most recent Mortgage that was taken out on this home.
Original Mortgage
$188,000
Outstanding Balance
$80,005
Interest Rate
1.5%
Mortgage Type
Adjustable Rate Mortgage/ARM
Estimated Equity
$498,655
Create a Home Valuation Report for This Property
The Home Valuation Report is an in-depth analysis detailing your home's value as well as a comparison with similar homes in the area
Home Values in the Area
Average Home Value in this Area
Purchase History
| Date | Buyer | Sale Price | Title Company |
|---|---|---|---|
| Herndon Kimberley | $235,000 | -- |
Source: Public Records
Mortgage History
| Date | Status | Borrower | Loan Amount |
|---|---|---|---|
| Open | Herndon Kimberley | $188,000 |
Source: Public Records
Tax History Compared to Growth
Tax History
| Year | Tax Paid | Tax Assessment Tax Assessment Total Assessment is a certain percentage of the fair market value that is determined by local assessors to be the total taxable value of land and additions on the property. | Land | Improvement |
|---|---|---|---|---|
| 2025 | $5,263 | $454,500 | $196,400 | $258,100 |
| 2024 | $4,806 | $440,900 | $150,700 | $290,200 |
| 2023 | $4,735 | $440,900 | $150,700 | $290,200 |
| 2022 | $4,361 | $400,800 | $137,000 | $263,800 |
| 2021 | $4,277 | $400,800 | $137,000 | $263,800 |
| 2020 | $3,690 | $349,400 | $129,000 | $220,400 |
| 2019 | $3,451 | $327,400 | $101,300 | $226,100 |
| 2018 | $3,120 | $297,700 | $101,300 | $196,400 |
| 2017 | $3,059 | $288,900 | $101,300 | $187,600 |
| 2016 | $3,026 | $275,100 | $101,300 | $173,800 |
| 2015 | $2,334 | $192,700 | $78,700 | $114,000 |
| 2014 | $2,354 | $187,100 | $78,700 | $108,400 |
Source: Public Records
Map
Nearby Homes
- 2 Otisfield St
- 36-38 Elm Hill Park
- 476 Warren St
- 472 Warren St
- 52 Intervale St
- 495 Warren St
- 175 Howard Ave Unit 2
- 31 Dewey St
- 7 Waumbeck St Unit 3
- 4 Wyoming St Unit 2
- 40 Devon St Unit 3
- 63 Normandy St
- 194 Blue Hill Ave
- 96-98 Woodledge St
- 8 Adrian St
- 16 Wabon St
- 47 Sargent St Unit 3
- 163 Howard Ave
- 12 Danube St
- 28 Wabon St
- 47 Holborn St
- 43 Holborn St
- 49 Holborn St
- 41 Holborn St
- 51 Holborn St
- 51 Holborn St Unit 5
- 36 Gaston St
- 38 Gaston St
- 39 Holborn St Unit 39A
- 34 Gaston St
- 40 Gaston St
- 40 Gaston St Unit 3
- 40 Gaston St Unit 1
- 32 Gaston St
- 37 Holborn St
- 40 Holborn St Unit 5
- 40 Holborn St Unit 3
- 40 Holborn St Unit 2R
- 40 Holborn St Unit 1
- 40 Holborn St Unit 2