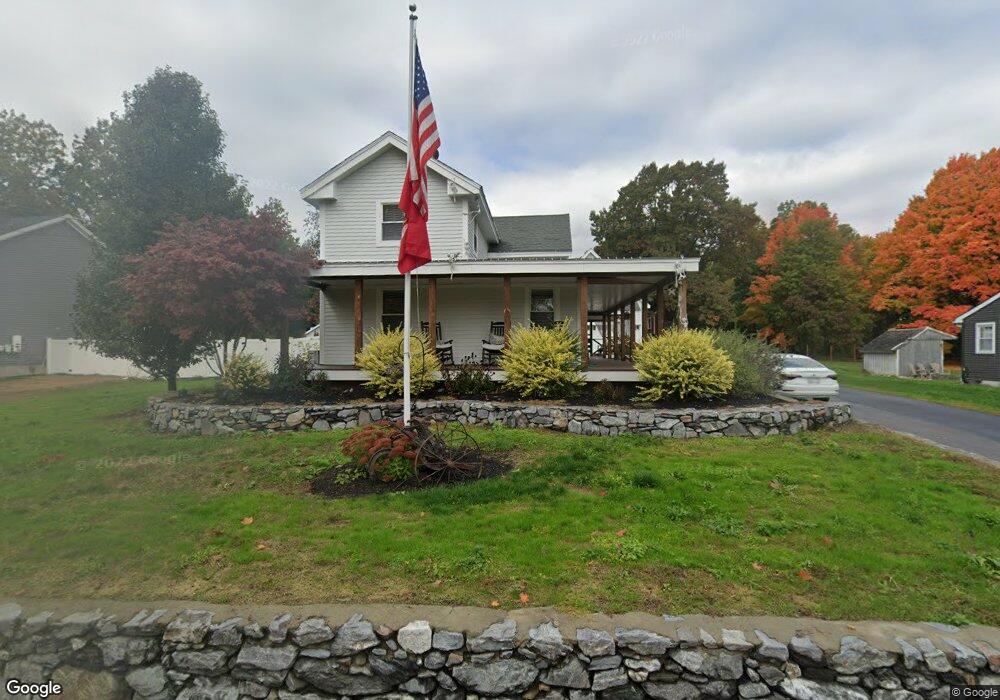
45 Lowe St Leominster, MA 01453
Estimated Value: $418,000 - $651,000
3
Beds
1
Bath
2,200
Sq Ft
$236/Sq Ft
Est. Value
About This Home
This home is located at 45 Lowe St, Leominster, MA 01453 and is currently estimated at $519,755, approximately $236 per square foot. 45 Lowe St is a home located in Worcester County with nearby schools including Leominster High School, St. Leo School, and St. Anna Catholic School.
Ownership History
Date
Name
Owned For
Owner Type
Purchase Details
Closed on
Dec 26, 2019
Sold by
Piermarini Lindo P Est
Bought by
Mimnaugh Kyle D
Current Estimated Value
Purchase Details
Closed on
May 30, 2017
Sold by
Piermarini Rt
Bought by
Piermarini Lindo P
Purchase Details
Closed on
Dec 19, 2013
Sold by
Piermarini Lindo P
Bought by
Piermarini Rt and Piermarini Lindo P
Purchase Details
Closed on
Oct 27, 1999
Sold by
Mammone Giacomina
Bought by
Greeno Angelina C and Greeno Stephen R
Create a Home Valuation Report for This Property
The Home Valuation Report is an in-depth analysis detailing your home's value as well as a comparison with similar homes in the area
Home Values in the Area
Average Home Value in this Area
Purchase History
| Date | Buyer | Sale Price | Title Company |
|---|---|---|---|
| Mimnaugh Kyle D | $148,000 | None Available | |
| Piermarini Lindo P | -- | -- | |
| Piermarini Rt | -- | -- | |
| Greeno Angelina C | $45,000 | -- |
Source: Public Records
Tax History Compared to Growth
Tax History
| Year | Tax Paid | Tax Assessment Tax Assessment Total Assessment is a certain percentage of the fair market value that is determined by local assessors to be the total taxable value of land and additions on the property. | Land | Improvement |
|---|---|---|---|---|
| 2025 | $5,950 | $424,100 | $180,400 | $243,700 |
| 2024 | $5,779 | $398,300 | $171,600 | $226,700 |
| 2023 | $5,535 | $356,200 | $149,300 | $206,900 |
| 2022 | $5,294 | $319,700 | $131,100 | $188,600 |
| 2021 | $5,316 | $293,200 | $104,300 | $188,900 |
| 2020 | $5,180 | $288,100 | $104,300 | $183,800 |
| 2019 | $4,978 | $268,500 | $99,900 | $168,600 |
| 2018 | $4,515 | $233,600 | $97,200 | $136,400 |
| 2017 | $4,384 | $222,200 | $90,800 | $131,400 |
| 2016 | $4,118 | $210,300 | $90,800 | $119,500 |
| 2015 | $3,956 | $203,500 | $90,800 | $112,700 |
| 2014 | $3,787 | $200,500 | $95,700 | $104,800 |
Source: Public Records
Map
Nearby Homes