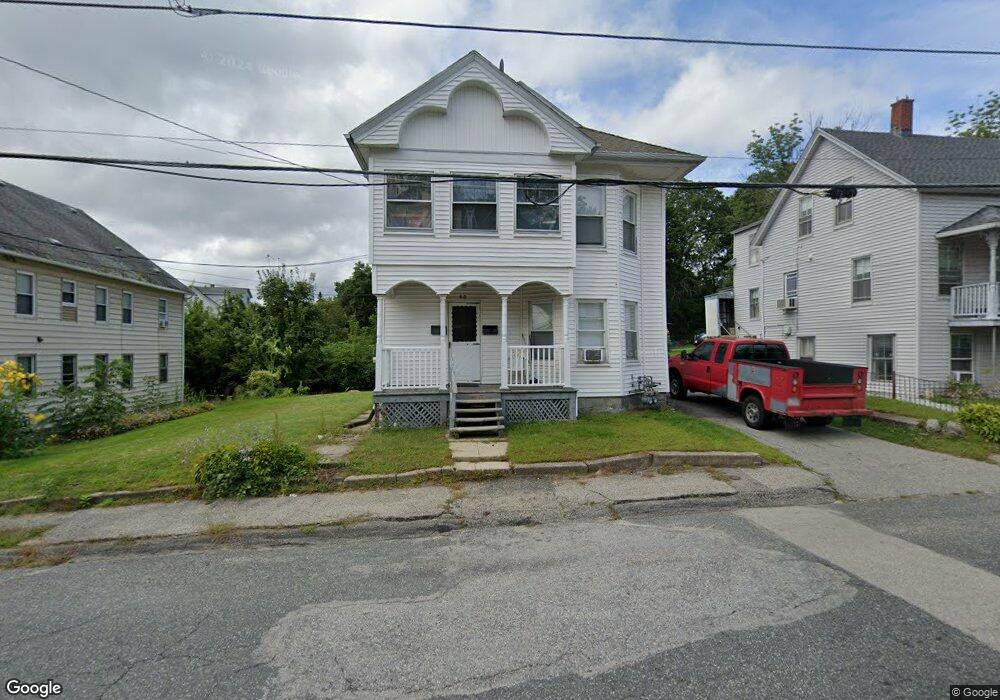
45 Oxford Ave Dudley, MA 01571
Estimated Value: $365,421 - $421,000
4
Beds
2
Baths
1,824
Sq Ft
$216/Sq Ft
Est. Value
About This Home
This home is located at 45 Oxford Ave, Dudley, MA 01571 and is currently estimated at $394,605, approximately $216 per square foot. 45 Oxford Ave is a home located in Worcester County with nearby schools including Shepherd Hill Regional High School, All Saints Academy, and St Joseph School.
Ownership History
Date
Name
Owned For
Owner Type
Purchase Details
Closed on
Aug 30, 2006
Sold by
Niedbala Kristina H
Bought by
Ruiz Macrina and Ruiz Rigoberto
Current Estimated Value
Home Financials for this Owner
Home Financials are based on the most recent Mortgage that was taken out on this home.
Original Mortgage
$166,400
Outstanding Balance
$100,798
Interest Rate
6.83%
Mortgage Type
Purchase Money Mortgage
Estimated Equity
$293,807
Create a Home Valuation Report for This Property
The Home Valuation Report is an in-depth analysis detailing your home's value as well as a comparison with similar homes in the area
Home Values in the Area
Average Home Value in this Area
Purchase History
| Date | Buyer | Sale Price | Title Company |
|---|---|---|---|
| Ruiz Macrina | $208,000 | -- |
Source: Public Records
Mortgage History
| Date | Status | Borrower | Loan Amount |
|---|---|---|---|
| Open | Ruiz Macrina | $166,400 |
Source: Public Records
Tax History Compared to Growth
Tax History
| Year | Tax Paid | Tax Assessment Tax Assessment Total Assessment is a certain percentage of the fair market value that is determined by local assessors to be the total taxable value of land and additions on the property. | Land | Improvement |
|---|---|---|---|---|
| 2025 | $27 | $256,400 | $63,900 | $192,500 |
| 2024 | $2,564 | $244,700 | $60,500 | $184,200 |
| 2023 | $2,349 | $231,200 | $55,900 | $175,300 |
| 2022 | $2,325 | $198,700 | $49,000 | $149,700 |
| 2021 | $2,084 | $169,400 | $45,600 | $123,800 |
| 2020 | $1,972 | $151,000 | $42,200 | $108,800 |
| 2019 | $2,039 | $151,000 | $42,200 | $108,800 |
| 2018 | $1,740 | $148,300 | $42,200 | $106,100 |
| 2017 | $1,688 | $141,400 | $42,200 | $99,200 |
| 2016 | $1,773 | $145,600 | $40,200 | $105,400 |
| 2015 | $1,756 | $143,200 | $37,800 | $105,400 |
Source: Public Records
Map
Nearby Homes