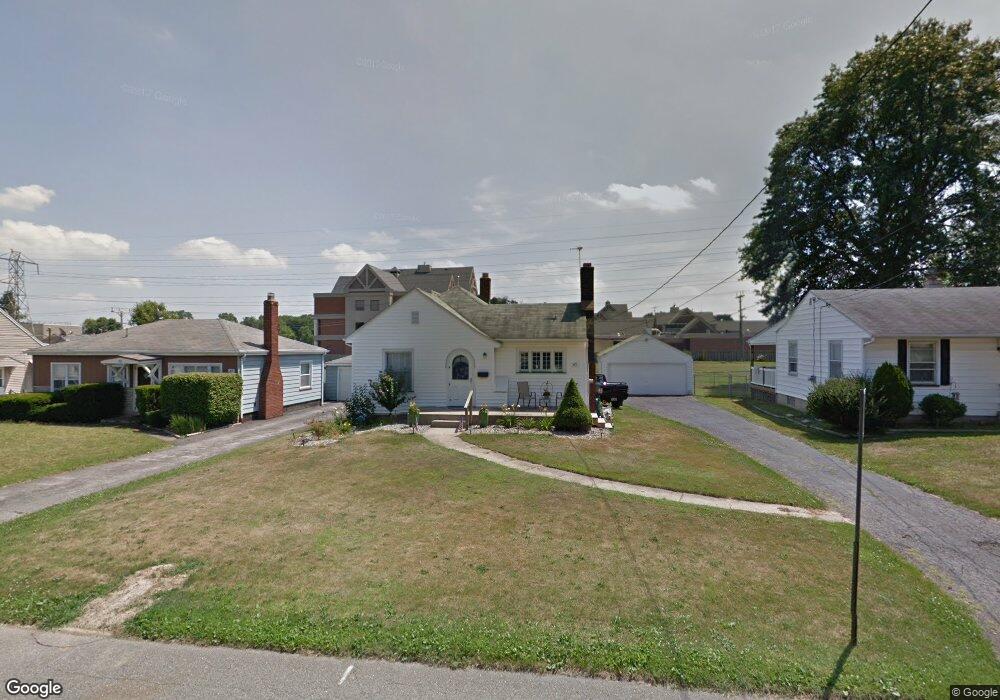
45 Romaine Ave Youngstown, OH 44512
Estimated Value: $109,000 - $117,000
2
Beds
2
Baths
905
Sq Ft
$127/Sq Ft
Est. Value
About This Home
This home is located at 45 Romaine Ave, Youngstown, OH 44512 and is currently estimated at $114,753, approximately $126 per square foot. 45 Romaine Ave is a home located in Mahoning County with nearby schools including Boardman Glenwood Junior High School, Boardman High School, and Youngstown Christian School.
Ownership History
Date
Name
Owned For
Owner Type
Purchase Details
Closed on
Jan 30, 2012
Sold by
Bowyer Erik J and Bower Brittany N
Bought by
Bowyer Erik J and Bowyer Brittany N
Current Estimated Value
Purchase Details
Closed on
Nov 23, 2009
Sold by
Bestic Barbara and Bestic Mark M
Bought by
Bowyer Erik J
Home Financials for this Owner
Home Financials are based on the most recent Mortgage that was taken out on this home.
Original Mortgage
$46,148
Outstanding Balance
$29,978
Interest Rate
4.9%
Mortgage Type
FHA
Estimated Equity
$84,775
Purchase Details
Closed on
Oct 22, 2009
Sold by
Estate Of Majorie E Nelson
Bought by
Bestic Barbara
Home Financials for this Owner
Home Financials are based on the most recent Mortgage that was taken out on this home.
Original Mortgage
$46,148
Outstanding Balance
$29,978
Interest Rate
4.9%
Mortgage Type
FHA
Estimated Equity
$84,775
Purchase Details
Closed on
Nov 12, 1987
Bought by
Nelson Marjorie E
Create a Home Valuation Report for This Property
The Home Valuation Report is an in-depth analysis detailing your home's value as well as a comparison with similar homes in the area
Home Values in the Area
Average Home Value in this Area
Purchase History
| Date | Buyer | Sale Price | Title Company |
|---|---|---|---|
| Bowyer Erik J | -- | Attorney | |
| Bowyer Erik J | $47,000 | Assurance Land Title | |
| Bestic Barbara | -- | Attorney | |
| Nelson Marjorie E | -- | -- |
Source: Public Records
Mortgage History
| Date | Status | Borrower | Loan Amount |
|---|---|---|---|
| Open | Bowyer Erik J | $46,148 |
Source: Public Records
Tax History Compared to Growth
Tax History
| Year | Tax Paid | Tax Assessment Tax Assessment Total Assessment is a certain percentage of the fair market value that is determined by local assessors to be the total taxable value of land and additions on the property. | Land | Improvement |
|---|---|---|---|---|
| 2024 | $1,467 | $28,910 | $3,540 | $25,370 |
| 2023 | $1,447 | $28,910 | $3,540 | $25,370 |
| 2022 | $1,184 | $18,040 | $3,540 | $14,500 |
| 2021 | $1,185 | $18,040 | $3,540 | $14,500 |
| 2020 | $1,191 | $18,040 | $3,540 | $14,500 |
| 2019 | $1,174 | $15,820 | $3,100 | $12,720 |
| 2018 | $1,006 | $15,820 | $3,100 | $12,720 |
| 2017 | $1,003 | $15,820 | $3,100 | $12,720 |
| 2016 | $1,023 | $15,980 | $3,360 | $12,620 |
| 2015 | $1,003 | $15,980 | $3,360 | $12,620 |
| 2014 | $1,006 | $15,980 | $3,360 | $12,620 |
| 2013 | $993 | $15,980 | $3,360 | $12,620 |
Source: Public Records
Map
Nearby Homes
- 26 Marlindale Ave
- 103 Wildwood Dr
- 197 Mathews Rd Unit B
- 6511 Pembrooke Place
- 44 Gertrude Ave
- 96 Aylesboro Ave
- 6726 Glendale Ave
- 6001 Applecrest Dr
- 242 Oakley Ave
- 149 Argyle Ave
- 169 Wolcott Dr
- 642 Oakridge Dr
- 0 Mathews Rd Unit 5038026
- 33 Crestline Place
- 6785 Tanglewood Dr
- 7110 Amherst Ave
- 235 Wolcott Dr
- 167 Afton Ave
- 7005 Paxton Rd
- 81 Melrose Ave