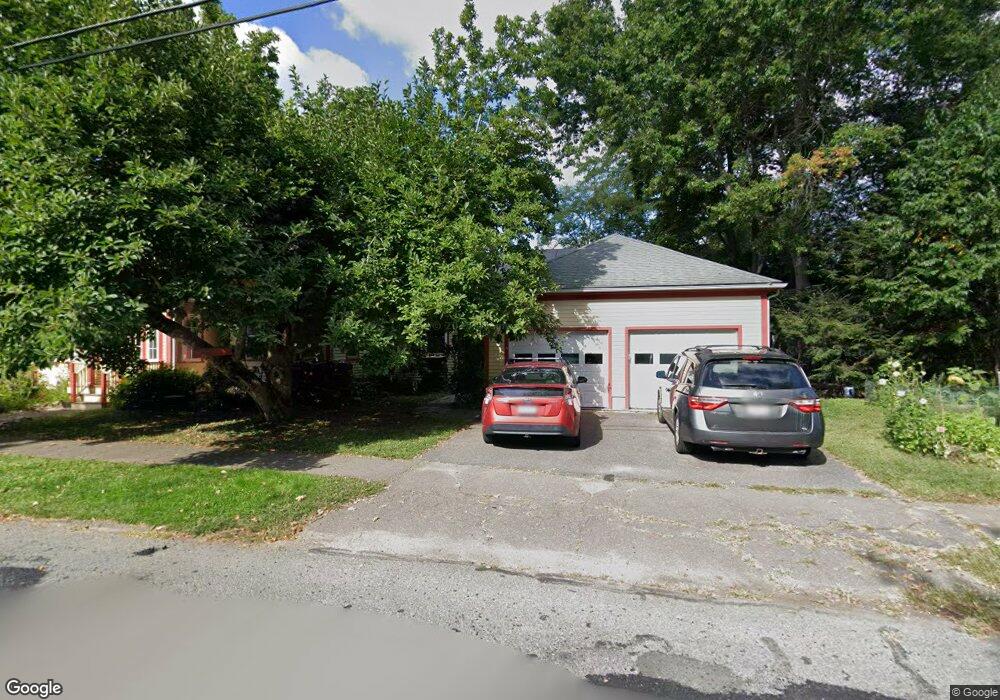
45 Vernon St Northampton, MA 01060
Estimated Value: $700,000 - $925,879
5
Beds
4
Baths
2,750
Sq Ft
$310/Sq Ft
Est. Value
About This Home
This home is located at 45 Vernon St, Northampton, MA 01060 and is currently estimated at $851,970, approximately $309 per square foot. 45 Vernon St is a home located in Hampshire County with nearby schools including Northampton High School, Hilltown Cooperative Charter Public School, and The Montessori School of Northampton.
Ownership History
Date
Name
Owned For
Owner Type
Purchase Details
Closed on
Dec 20, 2024
Sold by
Finke Bruce S and Coates Elizabeth A
Bought by
Coates -Finke Ft and Finke
Current Estimated Value
Purchase Details
Closed on
Apr 10, 2003
Sold by
Swan V Mahi
Bought by
Finke Bruce S and Coates Elizabeth A
Home Financials for this Owner
Home Financials are based on the most recent Mortgage that was taken out on this home.
Original Mortgage
$276,000
Interest Rate
5.86%
Mortgage Type
Purchase Money Mortgage
Create a Home Valuation Report for This Property
The Home Valuation Report is an in-depth analysis detailing your home's value as well as a comparison with similar homes in the area
Home Values in the Area
Average Home Value in this Area
Purchase History
| Date | Buyer | Sale Price | Title Company |
|---|---|---|---|
| Coates -Finke Ft | -- | None Available | |
| Finke Bruce S | $335,580 | -- | |
| Finke Bruce S | $335,580 | -- |
Source: Public Records
Mortgage History
| Date | Status | Borrower | Loan Amount |
|---|---|---|---|
| Previous Owner | Finke Bruce S | $417,000 | |
| Previous Owner | Finke Bruce S | $276,000 |
Source: Public Records
Tax History Compared to Growth
Tax History
| Year | Tax Paid | Tax Assessment Tax Assessment Total Assessment is a certain percentage of the fair market value that is determined by local assessors to be the total taxable value of land and additions on the property. | Land | Improvement |
|---|---|---|---|---|
| 2025 | $10,583 | $759,700 | $256,500 | $503,200 |
| 2024 | $10,525 | $692,900 | $256,500 | $436,400 |
| 2023 | $12,084 | $762,900 | $256,400 | $506,500 |
| 2022 | $10,451 | $584,200 | $239,700 | $344,500 |
| 2021 | $10,518 | $605,500 | $228,300 | $377,200 |
| 2020 | $10,172 | $605,500 | $228,300 | $377,200 |
| 2019 | $9,467 | $545,000 | $201,900 | $343,100 |
| 2018 | $9,142 | $536,500 | $201,900 | $334,600 |
| 2017 | $8,954 | $536,500 | $201,900 | $334,600 |
| 2016 | $8,670 | $536,500 | $201,900 | $334,600 |
| 2015 | $8,981 | $568,400 | $201,900 | $366,500 |
| 2014 | $8,748 | $568,400 | $201,900 | $366,500 |
Source: Public Records
Map
Nearby Homes
- 49 Kensington Ave
- 63 Riverside Dr
- 218 Elm St
- 61 Woodlawn Ave
- 14 Arlington St
- 11 Norwood Ave
- 321 Riverside Dr
- 325 Riverside Dr
- 37 Finn St
- 215 State St
- 0 Terrace Ln
- 74 Barrett St Unit 105
- 35 New South St Unit 307
- 43 Center St Unit K
- 244 Main St
- 12 School St
- 67 Old South St
- 9 Walnut St Unit B
- 152 S Main St Unit 4
- 30 Cherry St