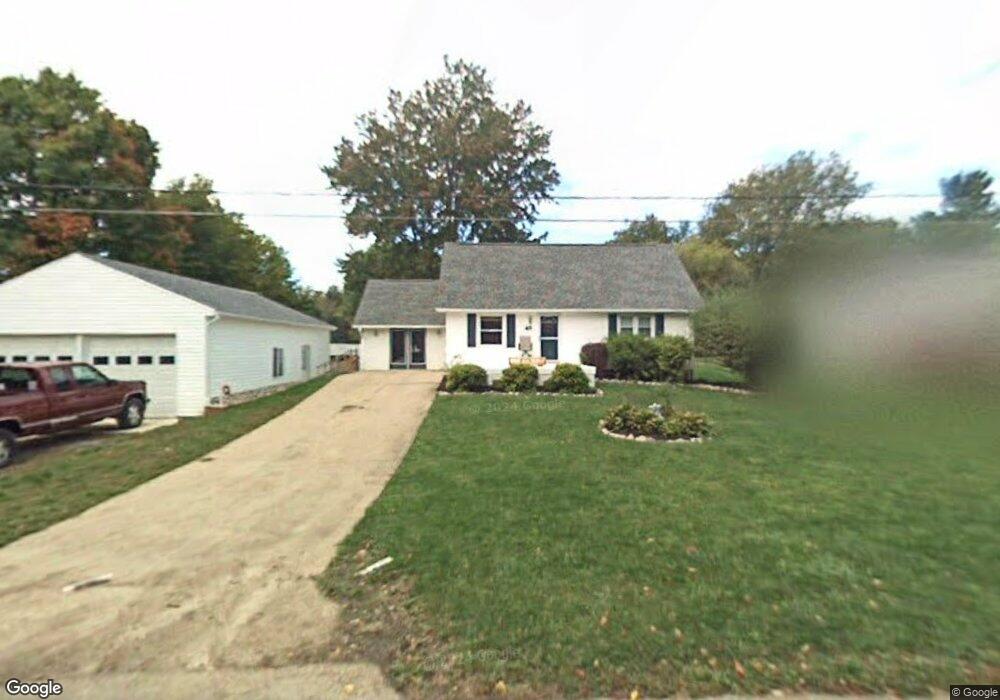
45 Walnut St Sunbury, OH 43074
Estimated Value: $286,000 - $359,000
4
Beds
1
Bath
1,208
Sq Ft
$270/Sq Ft
Est. Value
About This Home
This home is located at 45 Walnut St, Sunbury, OH 43074 and is currently estimated at $325,839, approximately $269 per square foot. 45 Walnut St is a home located in Delaware County with nearby schools including Big Walnut Intermediate School, Big Walnut Middle School, and Big Walnut High School.
Ownership History
Date
Name
Owned For
Owner Type
Purchase Details
Closed on
Feb 8, 2013
Sold by
Settles Robert E and Settles Holly M
Bought by
Settles Robert E and Settles Robert E
Current Estimated Value
Home Financials for this Owner
Home Financials are based on the most recent Mortgage that was taken out on this home.
Original Mortgage
$153,858
Outstanding Balance
$107,206
Interest Rate
3.34%
Mortgage Type
FHA
Estimated Equity
$218,633
Purchase Details
Closed on
Sep 13, 2004
Sold by
Evans Douglas M and Evans Theresa J
Bought by
Settles Robert E and Starling Holly M
Home Financials for this Owner
Home Financials are based on the most recent Mortgage that was taken out on this home.
Original Mortgage
$134,000
Interest Rate
5.85%
Mortgage Type
Purchase Money Mortgage
Purchase Details
Closed on
Feb 4, 1997
Sold by
Zeise Gerald A
Bought by
Evans Donna L
Create a Home Valuation Report for This Property
The Home Valuation Report is an in-depth analysis detailing your home's value as well as a comparison with similar homes in the area
Home Values in the Area
Average Home Value in this Area
Purchase History
| Date | Buyer | Sale Price | Title Company |
|---|---|---|---|
| Settles Robert E | -- | None Available | |
| Settles Robert E | $131,900 | Lawyers Title | |
| Evans Donna L | $23,000 | -- |
Source: Public Records
Mortgage History
| Date | Status | Borrower | Loan Amount |
|---|---|---|---|
| Open | Settles Robert E | $153,858 | |
| Previous Owner | Settles Robert E | $134,000 |
Source: Public Records
Tax History Compared to Growth
Tax History
| Year | Tax Paid | Tax Assessment Tax Assessment Total Assessment is a certain percentage of the fair market value that is determined by local assessors to be the total taxable value of land and additions on the property. | Land | Improvement |
|---|---|---|---|---|
| 2024 | $3,755 | $93,490 | $22,160 | $71,330 |
| 2023 | $3,663 | $93,490 | $22,160 | $71,330 |
| 2022 | $2,842 | $63,010 | $13,690 | $49,320 |
| 2021 | $2,856 | $63,010 | $13,690 | $49,320 |
| 2020 | $2,867 | $63,010 | $13,690 | $49,320 |
| 2019 | $2,421 | $51,170 | $11,410 | $39,760 |
| 2018 | $2,279 | $51,170 | $11,410 | $39,760 |
| 2017 | $2,034 | $47,010 | $10,710 | $36,300 |
| 2016 | $1,886 | $47,010 | $10,710 | $36,300 |
| 2015 | $1,897 | $47,010 | $10,710 | $36,300 |
| 2014 | $1,967 | $47,010 | $10,710 | $36,300 |
| 2013 | $2,076 | $45,960 | $10,710 | $35,250 |
Source: Public Records
Map
Nearby Homes
- 320 E Cherry St
- 285 E Cherry St
- 349 Laurel Ct
- 0 Hartford Rd Unit 8.17 acres 225016432
- 285 E Granville St
- 0 Ohio 37 Unit 225026227
- 202 N Columbus St
- 200 Greenbrier Rd
- 732 N State Route 61
- 956 N State Route 61
- 408 Village Ln
- 388 Millers Cove Ct
- 23029 Ohio 37
- 2177 Common Bent Dr
- 0 W Cherry St
- 211 Leather Leaf Cir
- 239 Millpond Rd Unit 239
- 300 Fox Trail Dr
- 561 Fields Meadow Dr
- 761 Buckeye Cir Unit Lot 2392
- 37 Walnut St
- 55 Walnut St
- 376 E Cherry St
- 29 Walnut St
- 362 E Cherry St
- 75 Walnut St
- 10 Walnut St
- 21 Walnut St
- 360 E Cherry St
- 345 Mcgill St
- 338 E Cherry St
- 377 E Cherry St
- 365 E Cherry St
- 334 E Cherry St
- 357 E Cherry St
- 328 E Cherry St
- 351 E Cherry St
- 341 E Cherry St
- 333 E Cherry St
- 333 E Cherry St Unit B