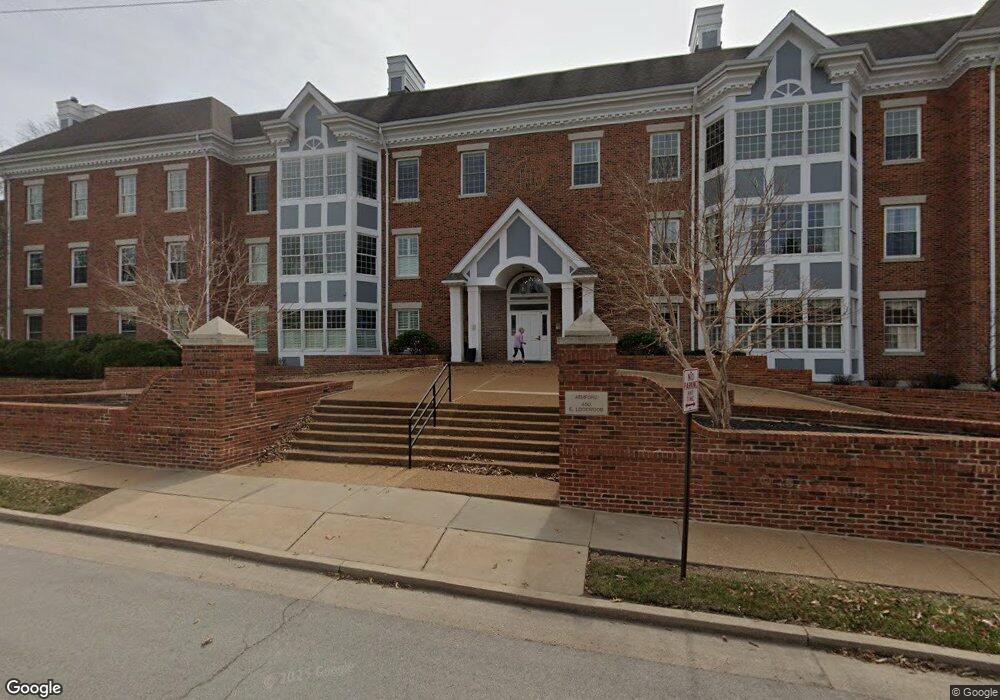
450 E Lockwood Ave Unit 106 Saint Louis, MO 63119
Estimated Value: $407,000 - $521,000
2
Beds
2
Baths
1,873
Sq Ft
$244/Sq Ft
Est. Value
About This Home
This home is located at 450 E Lockwood Ave Unit 106, Saint Louis, MO 63119 and is currently estimated at $457,677, approximately $244 per square foot. 450 E Lockwood Ave Unit 106 is a home located in St. Louis County with nearby schools including Bristol Elementary School, Hixson Middle School, and Webster Groves High School.
Ownership History
Date
Name
Owned For
Owner Type
Purchase Details
Closed on
Feb 4, 2010
Sold by
Richert Stanley and Richert Leah
Bought by
The Leah Y Richert Revocable Living Trus
Current Estimated Value
Purchase Details
Closed on
Oct 19, 2009
Sold by
Baisch Arthur J and Sprich Patricia A
Bought by
Richert Stanley and Richert Leah
Home Financials for this Owner
Home Financials are based on the most recent Mortgage that was taken out on this home.
Original Mortgage
$217,500
Outstanding Balance
$140,933
Interest Rate
4.93%
Mortgage Type
New Conventional
Estimated Equity
$316,744
Purchase Details
Closed on
Mar 21, 2001
Sold by
Zimmerman Harold S and Zimmerman Judy G
Bought by
Baisch Arthur J and Baisch Ruby E
Create a Home Valuation Report for This Property
The Home Valuation Report is an in-depth analysis detailing your home's value as well as a comparison with similar homes in the area
Home Values in the Area
Average Home Value in this Area
Purchase History
| Date | Buyer | Sale Price | Title Company |
|---|---|---|---|
| The Leah Y Richert Revocable Living Trus | -- | Integrity Land Title Co Inc | |
| Richert Stanley | $290,000 | Integrity Land Title | |
| Baisch Arthur J | $310,000 | -- | |
| Baisch Arthur J | -- | -- |
Source: Public Records
Mortgage History
| Date | Status | Borrower | Loan Amount |
|---|---|---|---|
| Open | Richert Stanley | $217,500 |
Source: Public Records
Tax History Compared to Growth
Tax History
| Year | Tax Paid | Tax Assessment Tax Assessment Total Assessment is a certain percentage of the fair market value that is determined by local assessors to be the total taxable value of land and additions on the property. | Land | Improvement |
|---|---|---|---|---|
| 2025 | $5,047 | $84,190 | $22,780 | $61,410 |
| 2024 | $5,047 | $73,210 | $24,910 | $48,300 |
| 2023 | $5,022 | $73,210 | $24,910 | $48,300 |
| 2022 | $4,755 | $64,390 | $24,910 | $39,480 |
| 2021 | $4,739 | $64,390 | $24,910 | $39,480 |
| 2020 | $4,914 | $62,210 | $24,910 | $37,300 |
| 2019 | $4,879 | $62,210 | $24,910 | $37,300 |
| 2018 | $4,144 | $46,930 | $10,680 | $36,250 |
| 2017 | $4,116 | $46,930 | $10,680 | $36,250 |
| 2016 | $3,839 | $41,840 | $9,790 | $32,050 |
| 2015 | $3,868 | $41,840 | $9,790 | $32,050 |
| 2014 | $4,115 | $43,310 | $11,690 | $31,620 |
Source: Public Records
Map
Nearby Homes
- 450 E Lockwood Ave Unit 303
- 8361 Big Bend Blvd
- 426 Pasadena Ave
- 234 Plant Ave
- 441 Park Rd
- 400 Marion Ave
- 203 E Jackson Rd
- 7826 Grove Ave
- 112 Oakwood Ave
- 717 Yale Ave
- 610 Cornelia Ave
- 125 E Frisco Ave
- 426 S Maple Ave
- 619 N Bompart Ave
- 431 Landscape Ct
- 544 Summit Ave
- 5000 Wilshusen Ave
- 808 Greeley Ave
- 156 Gray Ave
- 737 Landscape Ave
- 450 E Lockwood Ave Unit 208
- 450 E Lockwood Ave Unit 306
- 450 E Lockwood Ave Unit 203
- 450 E Lockwood Ave Unit 305
- 450 E Lockwood Ave Unit 201
- 450 E Lockwood Ave Unit 109
- 450 E Lockwood Ave Unit 202
- 450 E Lockwood Ave Unit 307
- 450 E Lockwood Ave Unit 209
- 450 E Lockwood Ave Unit 110
- 450 E Lockwood Ave Unit 107
- 450 E Lockwood Ave Unit 204
- 450 E Lockwood Ave Unit 102
- 450 E Lockwood Ave Unit 301
- 450 E Lockwood Ave Unit 304
- 450 E Lockwood Ave Unit 101
- 450 E Lockwood Ave Unit 210
- 450 E Lockwood Ave Unit 309
- 450 E Lockwood Ave Unit 205
- 450 E Lockwood Ave Unit 206