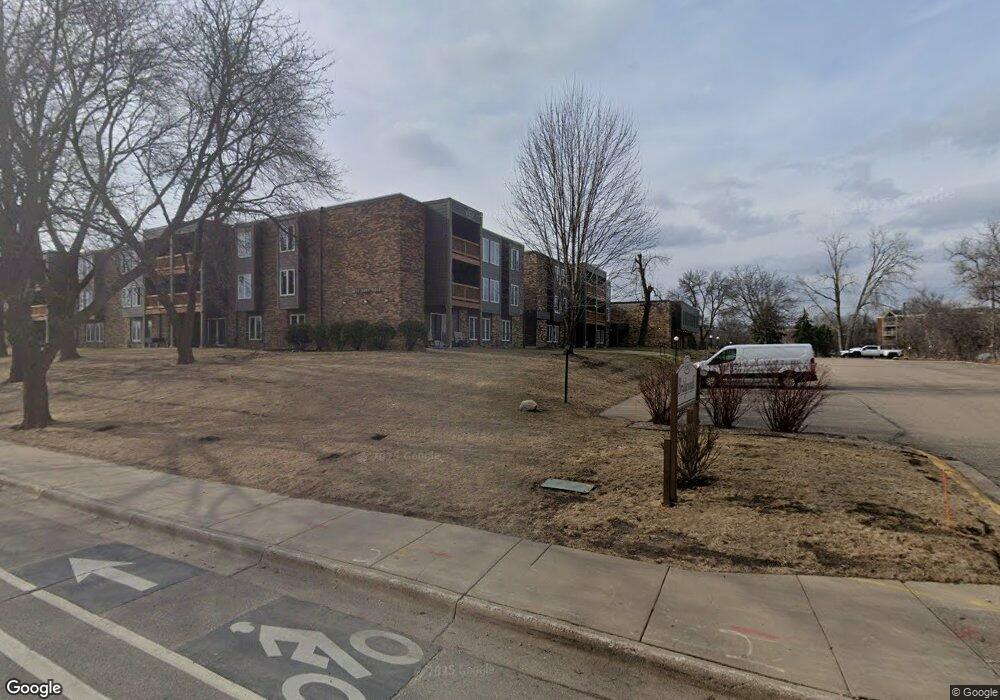
Bridge Walk Condominium 450 Ford Rd Unit 327 Saint Louis Park, MN 55426
Shelard Park NeighborhoodEstimated Value: $211,000 - $285,718
3
Beds
2
Baths
1,768
Sq Ft
$138/Sq Ft
Est. Value
About This Home
This home is located at 450 Ford Rd Unit 327, Saint Louis Park, MN 55426 and is currently estimated at $244,180, approximately $138 per square foot. 450 Ford Rd Unit 327 is a home located in Hennepin County with nearby schools including L.H. Tanglen Elementary School, Hopkins North Junior High School, and Hopkins Senior High School.
Ownership History
Date
Name
Owned For
Owner Type
Purchase Details
Closed on
Sep 20, 2019
Sold by
Olievskiy Dan V and Olievskiy Lulia
Bought by
Guimont Stanley B and Guimont Constance L Bruckelmyer
Current Estimated Value
Purchase Details
Closed on
Oct 27, 2017
Sold by
Laech Katherleen V and Laech Robert F
Bought by
Olievsiky Lilia
Home Financials for this Owner
Home Financials are based on the most recent Mortgage that was taken out on this home.
Original Mortgage
$33,750
Interest Rate
3.83%
Mortgage Type
New Conventional
Purchase Details
Closed on
Oct 14, 2010
Sold by
Federal Home Loan Mortgage Corporation
Bought by
Leach Kathleen V
Purchase Details
Closed on
Apr 7, 2006
Sold by
Conroy Gerald and Conroy Rosemary
Bought by
Simon Simone C
Purchase Details
Closed on
Sep 1, 1998
Sold by
Ditzler Properties Inc
Bought by
Conroy Rosemary
Create a Home Valuation Report for This Property
The Home Valuation Report is an in-depth analysis detailing your home's value as well as a comparison with similar homes in the area
Home Values in the Area
Average Home Value in this Area
Purchase History
| Date | Buyer | Sale Price | Title Company |
|---|---|---|---|
| Guimont Stanley B | $178,000 | Minnesota Title | |
| Olievsiky Lilia | $154,091 | Title Smart Inc | |
| Leach Kathleen V | $75,000 | -- | |
| Simon Simone C | $174,000 | -- | |
| Conroy Rosemary | $64,000 | -- |
Source: Public Records
Mortgage History
| Date | Status | Borrower | Loan Amount |
|---|---|---|---|
| Previous Owner | Olievsiky Lilia | $33,750 |
Source: Public Records
Tax History Compared to Growth
Tax History
| Year | Tax Paid | Tax Assessment Tax Assessment Total Assessment is a certain percentage of the fair market value that is determined by local assessors to be the total taxable value of land and additions on the property. | Land | Improvement |
|---|---|---|---|---|
| 2024 | $12,692 | $246,600 | $58,400 | $188,200 |
| 2023 | $12,221 | $214,500 | $50,800 | $163,700 |
| 2022 | $2,224 | $186,600 | $44,200 | $142,400 |
| 2021 | $2,064 | $183,900 | $43,600 | $140,300 |
| 2020 | $2,104 | $175,300 | $41,600 | $133,700 |
| 2019 | $1,837 | $171,100 | $40,600 | $130,500 |
| 2018 | $1,700 | $152,800 | $36,300 | $116,500 |
| 2017 | $1,493 | $125,200 | $29,900 | $95,300 |
| 2016 | $1,291 | $109,600 | $26,200 | $83,400 |
| 2015 | $1,630 | $105,400 | $25,200 | $80,200 |
| 2014 | -- | $105,000 | $25,100 | $79,900 |
Source: Public Records
About Bridge Walk Condominium
Map
Nearby Homes
- 450 Ford Rd Unit 225
- 450 Ford Rd Unit 227
- 450 Ford Rd Unit 111
- 450 Ford Rd Unit 223
- 450 Ford Rd Unit 101
- 450 Ford Rd Unit 217
- 1155 Ford Rd Unit 201
- 1155 Ford Rd Unit 402
- 1155 Ford Rd Unit 205
- 1155 Ford Rd Unit 504
- 1155 Ford Rd Unit 513
- 1155 Ford Rd Unit 414
- 1155 Ford Rd Unit 405
- 1155 Ford Rd Unit 203
- 1155 Ford Rd Unit 214
- 1155 Ford Rd Unit 314
- 1155 Ford Rd Unit 501
- 1155 Ford Rd Unit 512
- 340 Ford Rd Unit 5
- 445 Shelard Pkwy Unit 104
- 450 Ford Rd Unit 301
- 450 Ford Rd Unit 205
- 450 Ford Rd Unit 324
- 450 Ford Rd Unit 212
- 450 Ford Rd Unit 215
- 450 Ford Rd Unit 226
- 450 Ford Rd Unit 304
- 450 Ford Rd Unit 305
- 450 Ford Rd Unit 306
- 450 Ford Rd Unit 308
- 450 Ford Rd Unit 322
- 450 Ford Rd Unit 328
- 450 Ford Rd Unit 214
- 450 Ford Rd Unit 230
- 450 Ford Rd Unit 104
- 450 Ford Rd Unit 106
- 450 Ford Rd Unit 110
- 450 Ford Rd Unit 115
- 450 Ford Rd Unit 128
- 450 Ford Rd Unit 201