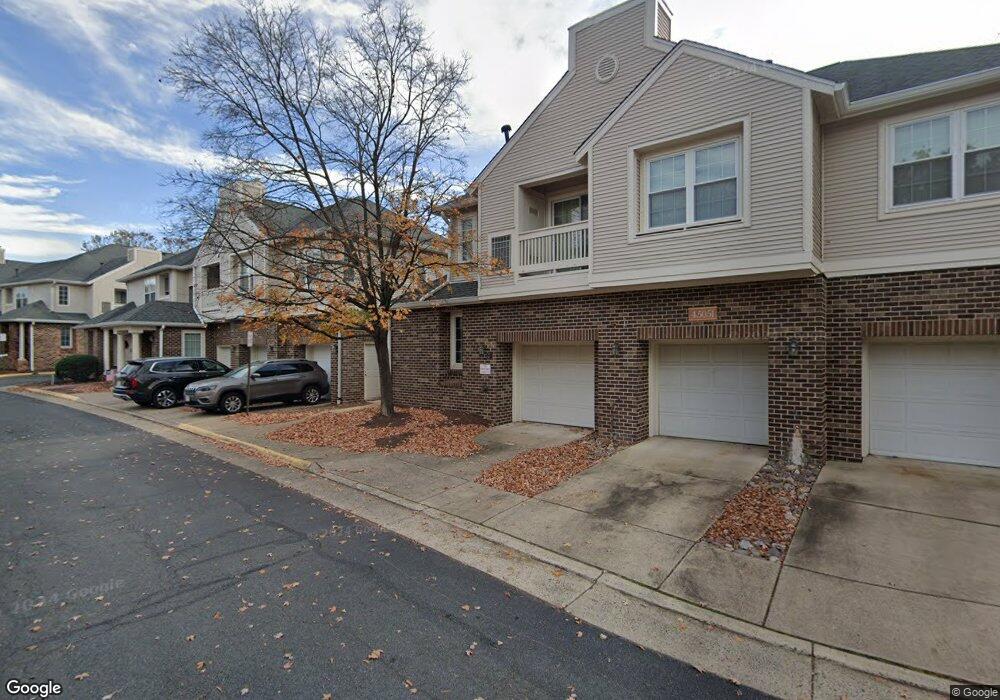
45051 Brae Terrace Unit 104 Ashburn, VA 20147
Estimated Value: $449,000 - $518,000
3
Beds
3
Baths
1,604
Sq Ft
$298/Sq Ft
Est. Value
About This Home
This home is located at 45051 Brae Terrace Unit 104, Ashburn, VA 20147 and is currently estimated at $478,523, approximately $298 per square foot. 45051 Brae Terrace Unit 104 is a home located in Loudoun County with nearby schools including Steuart W. Weller Elementary School, Belmont Ridge Middle, and Riverside High.
Ownership History
Date
Name
Owned For
Owner Type
Purchase Details
Closed on
Apr 7, 2004
Sold by
Fitch David
Bought by
Taw Khin
Current Estimated Value
Home Financials for this Owner
Home Financials are based on the most recent Mortgage that was taken out on this home.
Original Mortgage
$138,000
Outstanding Balance
$64,669
Interest Rate
5.6%
Mortgage Type
New Conventional
Estimated Equity
$413,854
Purchase Details
Closed on
Sep 3, 1997
Sold by
Johnson Family Trust
Bought by
Fitch David A and Fitch Mary J
Home Financials for this Owner
Home Financials are based on the most recent Mortgage that was taken out on this home.
Original Mortgage
$100,000
Interest Rate
7.36%
Mortgage Type
New Conventional
Purchase Details
Closed on
Jun 21, 1994
Sold by
2Nd Loudoun Condo Lp
Bought by
Johnson Alvinus P
Create a Home Valuation Report for This Property
The Home Valuation Report is an in-depth analysis detailing your home's value as well as a comparison with similar homes in the area
Home Values in the Area
Average Home Value in this Area
Purchase History
| Date | Buyer | Sale Price | Title Company |
|---|---|---|---|
| Taw Khin | $268,000 | -- | |
| Fitch David A | $125,000 | -- | |
| Johnson Alvinus P | $148,109 | -- |
Source: Public Records
Mortgage History
| Date | Status | Borrower | Loan Amount |
|---|---|---|---|
| Open | Taw Khin | $138,000 | |
| Previous Owner | Johnson Alvinus P | $100,000 |
Source: Public Records
Tax History Compared to Growth
Tax History
| Year | Tax Paid | Tax Assessment Tax Assessment Total Assessment is a certain percentage of the fair market value that is determined by local assessors to be the total taxable value of land and additions on the property. | Land | Improvement |
|---|---|---|---|---|
| 2025 | $3,518 | $437,060 | $115,000 | $322,060 |
| 2024 | $3,491 | $403,590 | $85,000 | $318,590 |
| 2023 | $3,501 | $400,120 | $85,000 | $315,120 |
| 2022 | $3,193 | $358,710 | $80,000 | $278,710 |
| 2021 | $3,111 | $317,490 | $70,000 | $247,490 |
| 2020 | $3,125 | $301,890 | $70,000 | $231,890 |
| 2019 | $3,223 | $308,420 | $80,000 | $228,420 |
| 2018 | $3,215 | $296,280 | $80,000 | $216,280 |
| 2017 | $3,275 | $291,080 | $80,000 | $211,080 |
| 2016 | $3,293 | $287,610 | $0 | $0 |
| 2015 | $3,264 | $207,610 | $0 | $207,610 |
| 2014 | $3,302 | $205,880 | $0 | $205,880 |
Source: Public Records
Map
Nearby Homes
- 20320 Beechwood Terrace Unit 202
- 20150 Dairy Ln
- 19889 Fieldgrass Square
- 44852 Tiverton Square
- 44848 Tiverton Square
- 44750 Tiverton Square
- 20304 Northpark Dr
- 45116 Admiral Dr
- 20254 Northpark Dr
- 20183 Northpark Dr
- 20189 Northpark Dr
- HOMESITE 52 Strabane Terrace
- HOMESITE 43 Strabane Terrace
- 44591 Strabane Terrace
- HOMESITE 49 Strabane Terrace
- 45206 Lettermore Square
- 44589 Strabane Terrace
- HOMESITE 39 Strabane Terrace
- 44583 Strabane Terrace
- 20694 Wood Quay Dr
- 45051 Brae Terrace Unit 103
- 45051 Brae Terrace Unit 204
- 45051 Brae Terrace Unit 203
- 45051 Brae Terrace Unit 101
- 45051 Brae Terrace Unit 102
- 45051 Brae Terrace Unit 201
- 45051 Brae Terrace Unit 105
- 45051 Brae Terrace Unit 202
- 45051 Brae Terrace
- 45050 Brae Terrace Unit 202
- 45050 Brae Terrace Unit 201
- 45050 Brae Terrace Unit 203
- 45050 Brae Terrace Unit 102
- 45050 Brae Terrace Unit 103
- 45061 Brae Terrace Unit 204
- 45061 Brae Terrace Unit 102
- 45061 Brae Terrace Unit 105
- 45061 Brae Terrace Unit 101
- 45061 Brae Terrace Unit 201
- 45061 Brae Terrace Unit 203