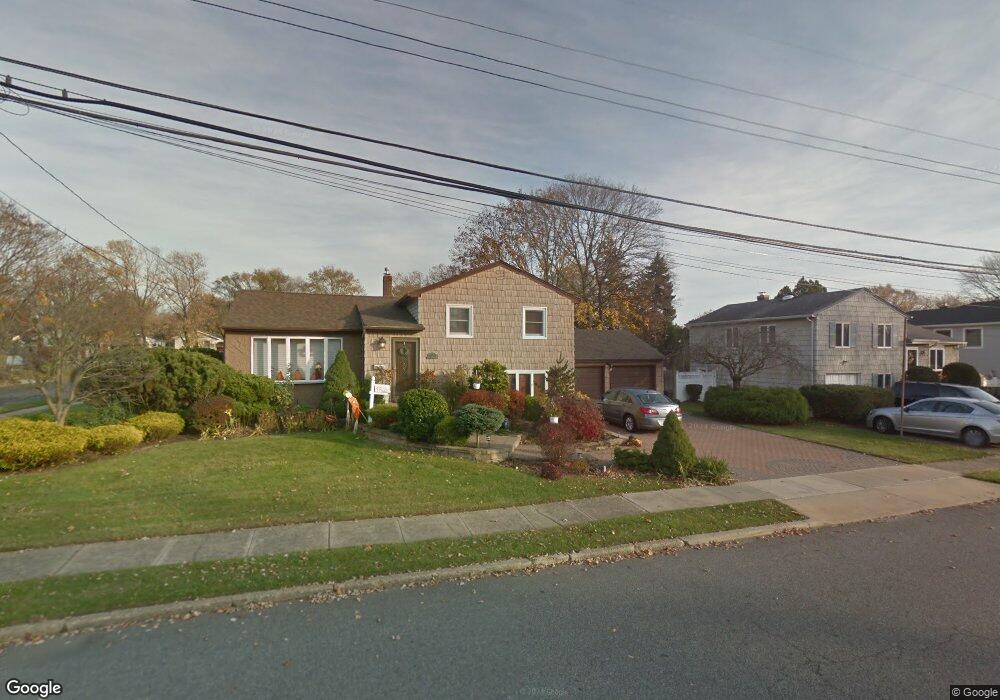
451 Broadway Massapequa Park, NY 11762
Estimated Value: $852,000 - $871,143
--
Bed
3
Baths
1,088
Sq Ft
$792/Sq Ft
Est. Value
About This Home
This home is located at 451 Broadway, Massapequa Park, NY 11762 and is currently estimated at $861,572, approximately $791 per square foot. 451 Broadway is a home located in Nassau County with nearby schools including Albany Avenue Elementary School, Weldon E. Howitt Middle School, and Farmingdale Senior High School.
Ownership History
Date
Name
Owned For
Owner Type
Purchase Details
Closed on
Jun 26, 2020
Sold by
Stork Nickolas and Stork Karen
Bought by
Stork Trust
Current Estimated Value
Purchase Details
Closed on
Sep 9, 2009
Sold by
Petrucci Ronald and Petrucci Patricia
Bought by
Stork Nickolas and Stork Karen
Purchase Details
Closed on
Jul 27, 2007
Sold by
Fuchs Lawrence
Bought by
Petrucci Ronald
Purchase Details
Closed on
Jul 1, 2002
Sold by
Adinolfi Edward
Bought by
Vosen Jean
Purchase Details
Closed on
Jul 31, 2000
Sold by
Schlitt Robert
Bought by
Fuchs Lawrence J
Create a Home Valuation Report for This Property
The Home Valuation Report is an in-depth analysis detailing your home's value as well as a comparison with similar homes in the area
Home Values in the Area
Average Home Value in this Area
Purchase History
| Date | Buyer | Sale Price | Title Company |
|---|---|---|---|
| Stork Trust | -- | None Available | |
| Stork Nickolas | $487,000 | -- | |
| Petrucci Ronald | $510,000 | -- | |
| Vosen Jean | $315,000 | -- | |
| Fuchs Lawrence J | $335,000 | Cathy Nolon |
Source: Public Records
Tax History Compared to Growth
Tax History
| Year | Tax Paid | Tax Assessment Tax Assessment Total Assessment is a certain percentage of the fair market value that is determined by local assessors to be the total taxable value of land and additions on the property. | Land | Improvement |
|---|---|---|---|---|
| 2025 | $12,693 | $586 | $298 | $288 |
| 2024 | $3,757 | $586 | $298 | $288 |
| 2023 | $10,825 | $586 | $298 | $288 |
| 2022 | $10,825 | $583 | $256 | $327 |
| 2021 | $10,024 | $562 | $232 | $330 |
| 2020 | $8,458 | $661 | $660 | $1 |
| 2019 | $2,878 | $725 | $658 | $67 |
| 2018 | $6,062 | $725 | $0 | $0 |
| 2017 | $6,062 | $822 | $746 | $76 |
| 2016 | $9,203 | $822 | $554 | $268 |
| 2015 | $2,722 | $868 | $585 | $283 |
| 2014 | $2,722 | $868 | $585 | $283 |
| 2013 | $3,229 | $1,106 | $746 | $360 |
Source: Public Records
Map
Nearby Homes