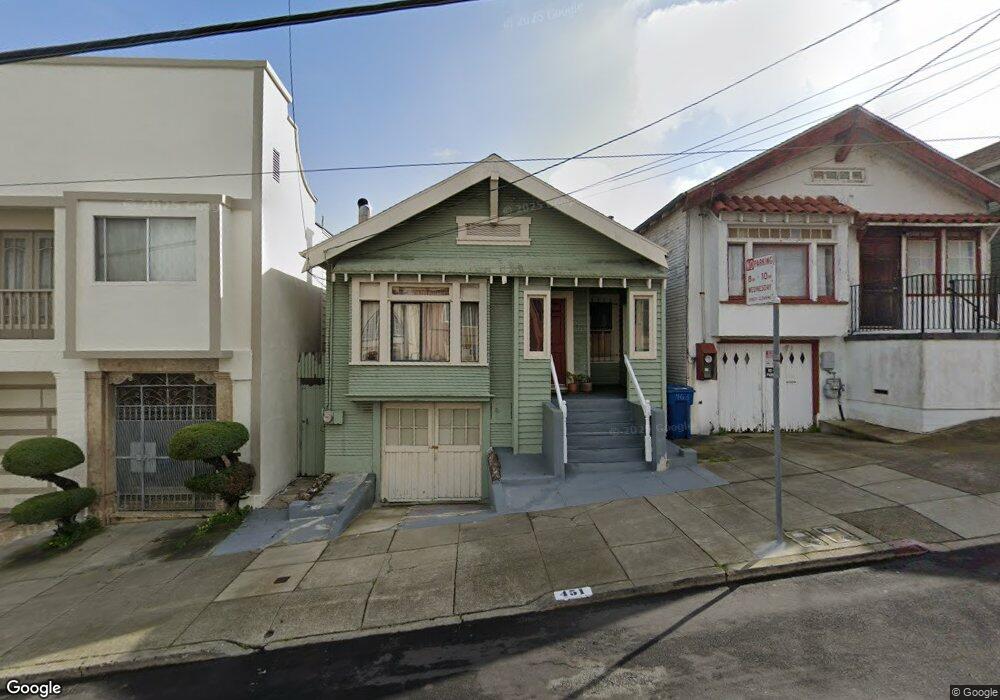
451 Evergreen Ave Daly City, CA 94014
Crocker NeighborhoodEstimated Value: $791,000 - $889,000
2
Beds
1
Bath
950
Sq Ft
$880/Sq Ft
Est. Value
About This Home
This home is located at 451 Evergreen Ave, Daly City, CA 94014 and is currently estimated at $836,177, approximately $880 per square foot. 451 Evergreen Ave is a home located in San Mateo County with nearby schools including George Washington Elementary School, Thomas R. Pollicita Middle School, and Jefferson High School.
Ownership History
Date
Name
Owned For
Owner Type
Purchase Details
Closed on
Apr 28, 2025
Sold by
Swartz Amada
Bought by
Amada Swartz 2025 Revocable Trust and Swartz
Current Estimated Value
Purchase Details
Closed on
Jan 30, 2024
Sold by
Robert William Swartz Revocable Living T
Bought by
Swartz Amada
Purchase Details
Closed on
Feb 18, 2009
Sold by
Swartz Robert William and Swartz Robert W
Bought by
Swartz Robert William
Purchase Details
Closed on
Jun 18, 2002
Sold by
Montalvo Dione R and Montalvo Dione Reginaldo
Bought by
Swartz Robert W and Swartz Robert William
Purchase Details
Closed on
Aug 18, 1997
Sold by
Swartz Robert William
Bought by
Montalvo Dione R and Montalvo Dione Reginaldo
Purchase Details
Closed on
Feb 10, 1997
Sold by
Deoni Montalvo and Reginaldo Dione
Bought by
Swartz Robert William
Purchase Details
Closed on
Apr 8, 1996
Sold by
Dominguez Dagoberto E and Dominguez Melida
Bought by
Swartz Robert William
Create a Home Valuation Report for This Property
The Home Valuation Report is an in-depth analysis detailing your home's value as well as a comparison with similar homes in the area
Home Values in the Area
Average Home Value in this Area
Purchase History
| Date | Buyer | Sale Price | Title Company |
|---|---|---|---|
| Amada Swartz 2025 Revocable Trust | -- | None Listed On Document | |
| Swartz Amada | -- | None Listed On Document | |
| Swartz Robert William | -- | None Available | |
| Swartz Robert W | -- | -- | |
| Montalvo Dione R | -- | -- | |
| Swartz Robert William | -- | -- | |
| Swartz Robert William | -- | -- |
Source: Public Records
Tax History Compared to Growth
Tax History
| Year | Tax Paid | Tax Assessment Tax Assessment Total Assessment is a certain percentage of the fair market value that is determined by local assessors to be the total taxable value of land and additions on the property. | Land | Improvement |
|---|---|---|---|---|
| 2025 | $2,980 | $239,631 | $115,671 | $123,960 |
| 2023 | $2,980 | $230,328 | $111,180 | $119,148 |
| 2022 | $2,846 | $225,812 | $109,000 | $116,812 |
| 2021 | $2,797 | $221,385 | $106,863 | $114,522 |
| 2020 | $2,839 | $219,116 | $105,768 | $113,348 |
| 2019 | $2,779 | $214,821 | $103,695 | $111,126 |
| 2018 | $2,617 | $210,610 | $101,662 | $108,948 |
| 2017 | $2,603 | $206,481 | $99,669 | $106,812 |
| 2016 | $2,471 | $202,433 | $97,715 | $104,718 |
| 2015 | $2,418 | $199,394 | $96,248 | $103,146 |
| 2014 | $2,340 | $195,489 | $94,363 | $101,126 |
Source: Public Records
Map
Nearby Homes
- 36 Alexander Ave
- 788 Templeton Ave
- 895 Bellevue Ave
- 891 Bellevue Ave
- 713 Acton St
- 40 Acton St
- 491 Pointe Pacific Unit 2
- 440 Pointe Pacific Unit 3
- 395 Frankfort St
- 323 Green Ridge Dr Unit 3
- 3223 San Jose Ave
- 100 Chelsea Ct Unit B
- 900 Huron Ave
- 89 Muirwood Dr
- 230 Rhine St
- 42 Farragut Ave
- 5698 Mission St
- 2921 Alemany Blvd
- 282 Greenview Dr
- 106 Broad St
- 439 Evergreen Ave
- 463 Evergreen Ave
- 184 Peoria St
- 475 Evergreen Ave
- 427 Evergreen Ave
- 415 Evergreen Ave
- 499 Evergreen Ave
- 499 Evergreen Ave Unit A
- 499 Evergreen Ave
- 983 Hanover St
- 178 Peoria St
- 401 Evergreen Ave
- 979 Hanover St
- 172 Peoria St
- 973 Hanover St
- 166 Peoria St
- 967 Hanover St
- 450 Evergreen Ave
- 501 Evergreen Ave
- 438 Evergreen Ave