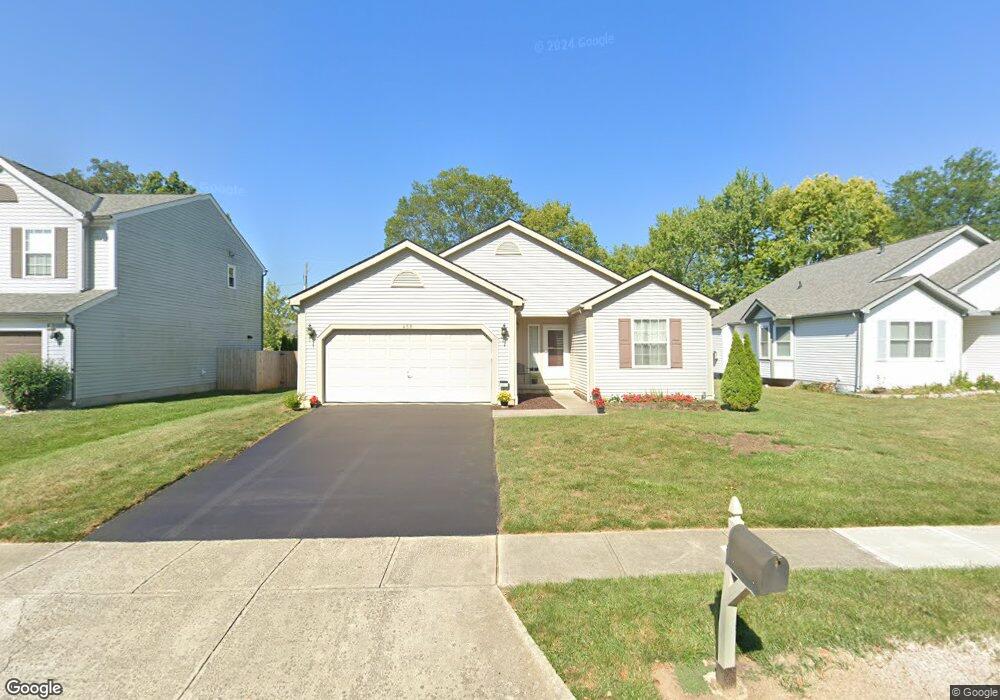
451 Tallman St Groveport, OH 43125
Estimated Value: $244,000 - $295,000
3
Beds
2
Baths
1,100
Sq Ft
$237/Sq Ft
Est. Value
About This Home
This home is located at 451 Tallman St, Groveport, OH 43125 and is currently estimated at $260,235, approximately $236 per square foot. 451 Tallman St is a home located in Franklin County with nearby schools including Groveport Madison High School, Groveport Community School, and Madison Christian School.
Ownership History
Date
Name
Owned For
Owner Type
Purchase Details
Closed on
Jul 23, 2010
Sold by
Fronza Thomas J and Fronza Christina
Bought by
Bosworth Jon L
Current Estimated Value
Home Financials for this Owner
Home Financials are based on the most recent Mortgage that was taken out on this home.
Original Mortgage
$111,900
Outstanding Balance
$74,285
Interest Rate
4.7%
Mortgage Type
Purchase Money Mortgage
Estimated Equity
$185,950
Purchase Details
Closed on
Sep 30, 2004
Sold by
Fronza Jean
Bought by
Fronza Thomas
Purchase Details
Closed on
Mar 20, 2002
Sold by
M/I Schottenstein Homes Inc
Bought by
Fronza Thomas J
Home Financials for this Owner
Home Financials are based on the most recent Mortgage that was taken out on this home.
Original Mortgage
$151,381
Interest Rate
6.87%
Mortgage Type
FHA
Create a Home Valuation Report for This Property
The Home Valuation Report is an in-depth analysis detailing your home's value as well as a comparison with similar homes in the area
Home Values in the Area
Average Home Value in this Area
Purchase History
| Date | Buyer | Sale Price | Title Company |
|---|---|---|---|
| Bosworth Jon L | $139,900 | Real Living | |
| Fronza Thomas | -- | -- | |
| Fronza Thomas J | $153,000 | Transohio Residential Title |
Source: Public Records
Mortgage History
| Date | Status | Borrower | Loan Amount |
|---|---|---|---|
| Open | Bosworth Jon L | $111,900 | |
| Previous Owner | Fronza Thomas J | $151,381 |
Source: Public Records
Tax History Compared to Growth
Tax History
| Year | Tax Paid | Tax Assessment Tax Assessment Total Assessment is a certain percentage of the fair market value that is determined by local assessors to be the total taxable value of land and additions on the property. | Land | Improvement |
|---|---|---|---|---|
| 2024 | $3,646 | $74,550 | $21,840 | $52,710 |
| 2023 | $3,614 | $74,550 | $21,840 | $52,710 |
| 2022 | $2,935 | $48,310 | $9,000 | $39,310 |
| 2021 | $2,946 | $48,310 | $9,000 | $39,310 |
| 2020 | $2,953 | $48,310 | $9,000 | $39,310 |
| 2019 | $2,794 | $40,290 | $7,490 | $32,800 |
| 2018 | $3,000 | $40,290 | $7,490 | $32,800 |
| 2017 | $2,816 | $40,290 | $7,490 | $32,800 |
| 2016 | $3,163 | $41,100 | $7,740 | $33,360 |
| 2015 | $3,191 | $41,100 | $7,740 | $33,360 |
| 2014 | $3,004 | $41,100 | $7,740 | $33,360 |
| 2013 | $1,348 | $43,260 | $8,155 | $35,105 |
Source: Public Records
Map
Nearby Homes