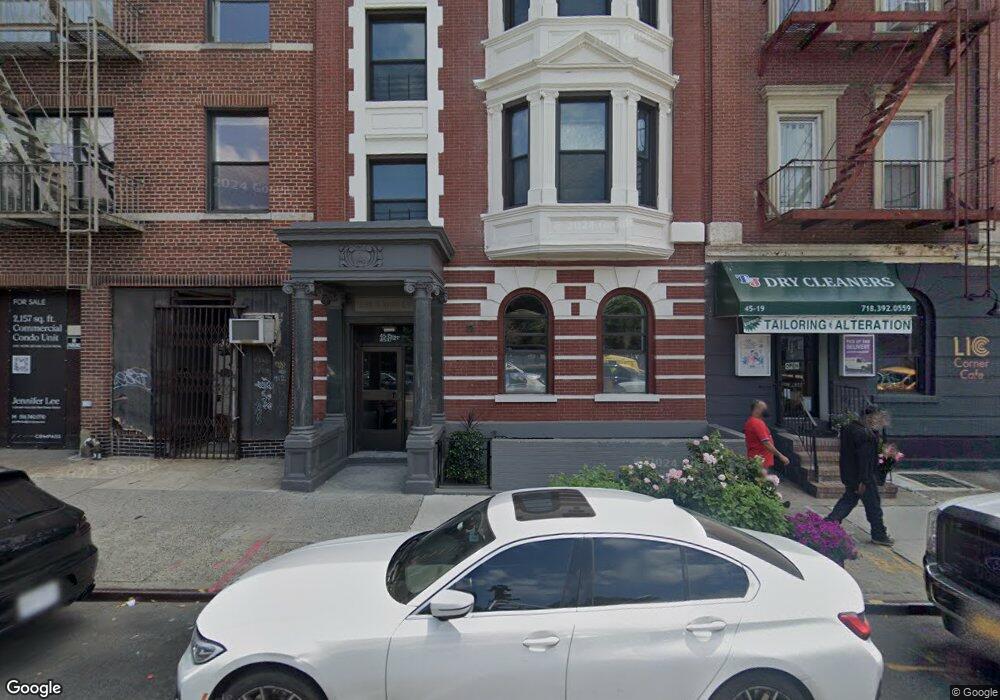
4517 21st St Unit 2A Long Island City, NY 11101
Hunters Point NeighborhoodEstimated Value: $790,000 - $1,594,000
--
Bed
--
Bath
953
Sq Ft
$1,239/Sq Ft
Est. Value
About This Home
This home is located at 4517 21st St Unit 2A, Long Island City, NY 11101 and is currently estimated at $1,180,728, approximately $1,238 per square foot. 4517 21st St Unit 2A is a home located in Queens County with nearby schools including P.S./I.S. 78Q Early Childhood Center, I.S. 204 Oliver W. Holmes, and Long Island City High School.
Ownership History
Date
Name
Owned For
Owner Type
Purchase Details
Closed on
Jun 30, 2022
Sold by
Burke Christopher
Bought by
Tung Cilian
Current Estimated Value
Purchase Details
Closed on
Feb 9, 2015
Sold by
Chan Perry and Sciasci Robert
Bought by
Burke Christopher
Purchase Details
Closed on
Feb 17, 2012
Sold by
Chan Perry
Bought by
Chan Perry and Sciasci Robert
Home Financials for this Owner
Home Financials are based on the most recent Mortgage that was taken out on this home.
Original Mortgage
$378,500
Interest Rate
3.99%
Mortgage Type
New Conventional
Purchase Details
Closed on
Sep 2, 2001
Sold by
Levas Andrew and Seidenspinner Utta
Bought by
Chan Perry
Home Financials for this Owner
Home Financials are based on the most recent Mortgage that was taken out on this home.
Original Mortgage
$208,000
Interest Rate
7.13%
Purchase Details
Closed on
Mar 20, 1995
Sold by
Immordino Vincent and Saraceno Salvatore
Bought by
Levas Andrew and Seidenspinner Utta
Create a Home Valuation Report for This Property
The Home Valuation Report is an in-depth analysis detailing your home's value as well as a comparison with similar homes in the area
Home Values in the Area
Average Home Value in this Area
Purchase History
| Date | Buyer | Sale Price | Title Company |
|---|---|---|---|
| Tung Cilian | $1,080,000 | -- | |
| Burke Christopher | $950,000 | -- | |
| Chan Perry | -- | -- | |
| Chan Perry | -- | -- | |
| Levas Andrew | $65,500 | Fidelity Title Ltd |
Source: Public Records
Mortgage History
| Date | Status | Borrower | Loan Amount |
|---|---|---|---|
| Previous Owner | Chan Perry | $378,500 | |
| Previous Owner | Chan Perry | $208,000 |
Source: Public Records
Tax History Compared to Growth
Tax History
| Year | Tax Paid | Tax Assessment Tax Assessment Total Assessment is a certain percentage of the fair market value that is determined by local assessors to be the total taxable value of land and additions on the property. | Land | Improvement |
|---|---|---|---|---|
| 2025 | $2,978 | $24,586 | $791 | $23,795 |
| 2024 | $2,978 | $23,820 | $919 | $22,901 |
| 2023 | $2,758 | $22,057 | $681 | $21,376 |
| 2022 | $2,499 | $103,420 | $3,152 | $100,268 |
| 2021 | $2,320 | $108,096 | $3,152 | $104,944 |
| 2020 | $2,359 | $118,808 | $3,152 | $115,656 |
| 2019 | $2,311 | $101,864 | $3,152 | $98,712 |
| 2018 | $2,158 | $16,967 | $630 | $16,337 |
| 2017 | $1,998 | $15,711 | $664 | $15,047 |
| 2016 | $1,876 | $15,711 | $664 | $15,047 |
| 2015 | $999 | $14,548 | $629 | $13,919 |
| 2014 | $999 | $14,095 | $610 | $13,485 |
Source: Public Records
Map
Nearby Homes
- 21-10 44th Dr Unit PHA
- 21-10 44th Dr
- 2110 44th Dr Unit 2B
- 21-30 44th Dr Unit 7-H
- 21-30 44th Dr Unit 6-A
- 21-30 44th Dr Unit 5-H
- 21-30 44th Dr Unit 6-I
- 21-30 44th Dr Unit 5-A
- 21-30 45th Rd Unit 1
- 11-52 44th Dr Unit 4-B
- 11-52 44th Dr Unit 2-C
- 11-52 44th Dr Unit 6-D
- 11-52 44th Dr Unit 7-A
- 11-52 44th Dr Unit 4-C
- 11-52 44th Dr Unit 3-D
- 11-52 44th Dr Unit 2-D
- 11-52 44th Dr Unit 2-A
- 11-52 44th Dr Unit A-2
- 11-52 44th Dr Unit 4-A
- 11-52 44th Dr Unit 7-B
- 4517 21st St Unit 5B
- 4517 21st St Unit 5A
- 4517 21st St Unit 4B
- 4517 21st St Unit 3B
- 4517 21st St Unit 3A
- 4517 21st St Unit 2B
- 4517 21st St Unit COM
- 4517 21st St Unit 4A
- 4517 21st St Unit 1B
- 4517 21st St
- 45-17 21 St St Unit 2-A
- 45-17 21 St St Unit 2-B
- 45-17 21 St St Unit 2-AB
- 45-17 21 St St Unit 1-B
- 45-17 21 St St Unit 3-A
- 45-17 21 St St Unit COMM
- 45-17 21st St Unit COMM
- 45-17 21st St Unit 1-B