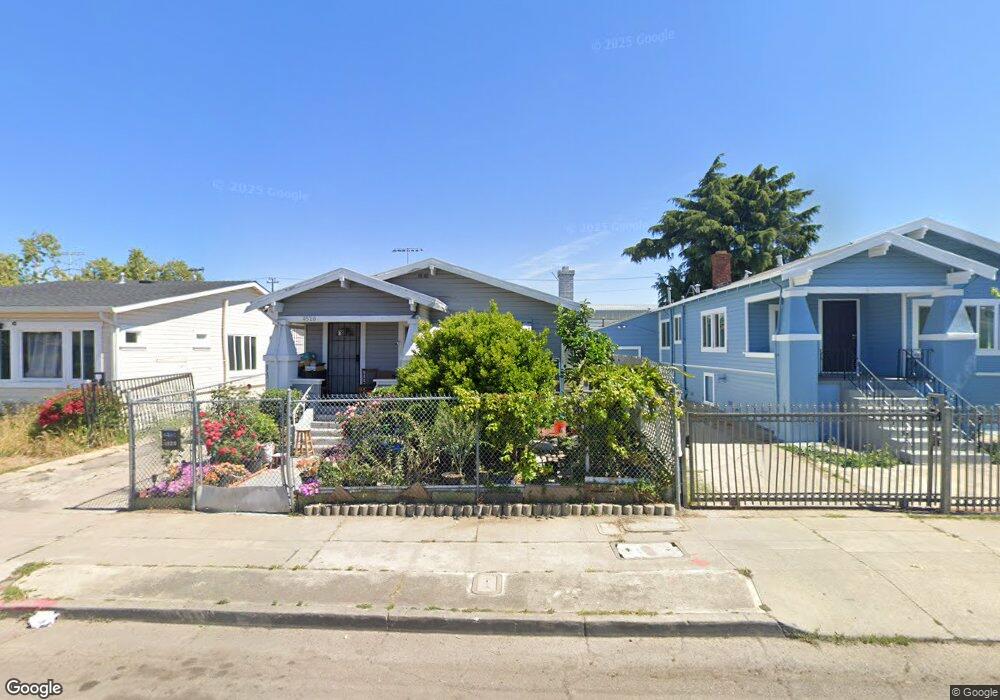
4520 Bond St Oakland, CA 94601
Fremont NeighborhoodEstimated Value: $369,000 - $452,137
2
Beds
1
Bath
1,008
Sq Ft
$411/Sq Ft
Est. Value
About This Home
This home is located at 4520 Bond St, Oakland, CA 94601 and is currently estimated at $414,034, approximately $410 per square foot. 4520 Bond St is a home located in Alameda County with nearby schools including Horace Mann Elementary School, Urban Promise Academy, and United For Success Academy.
Ownership History
Date
Name
Owned For
Owner Type
Purchase Details
Closed on
Apr 26, 2021
Sold by
Cao Phuoc Huu
Bought by
Cao Phuoc Huu and Nguyen Van H
Current Estimated Value
Home Financials for this Owner
Home Financials are based on the most recent Mortgage that was taken out on this home.
Original Mortgage
$450,000
Outstanding Balance
$407,175
Interest Rate
3%
Mortgage Type
New Conventional
Estimated Equity
$6,859
Purchase Details
Closed on
Oct 23, 2008
Sold by
Huynh Yen Hong
Bought by
Cao Phuoc Huu
Home Financials for this Owner
Home Financials are based on the most recent Mortgage that was taken out on this home.
Original Mortgage
$112,000
Interest Rate
5.9%
Mortgage Type
Purchase Money Mortgage
Purchase Details
Closed on
Oct 13, 2008
Sold by
Wachovia Mortgage Fsb
Bought by
Cao Phuoc Huu
Home Financials for this Owner
Home Financials are based on the most recent Mortgage that was taken out on this home.
Original Mortgage
$112,000
Interest Rate
5.9%
Mortgage Type
Purchase Money Mortgage
Purchase Details
Closed on
Sep 3, 2008
Sold by
Capito Patricio and Capito Angelina
Bought by
Wachovia Mortgage Fsb and World Savings Bank Fsb
Home Financials for this Owner
Home Financials are based on the most recent Mortgage that was taken out on this home.
Original Mortgage
$112,000
Interest Rate
5.9%
Mortgage Type
Purchase Money Mortgage
Purchase Details
Closed on
Oct 24, 2007
Sold by
Capito Angelina
Bought by
Capito Patricio D
Purchase Details
Closed on
Sep 15, 2005
Sold by
Capito Patricio and Capito Angelina
Bought by
Capito Patricio and Capito Angelina
Home Financials for this Owner
Home Financials are based on the most recent Mortgage that was taken out on this home.
Original Mortgage
$294,000
Interest Rate
5.81%
Mortgage Type
Stand Alone First
Purchase Details
Closed on
May 3, 1999
Sold by
Tandingan Melchor M and Tandingan Cecilia B
Bought by
Capito Patricio Delcarmen and Capito Angelina Domalin
Home Financials for this Owner
Home Financials are based on the most recent Mortgage that was taken out on this home.
Original Mortgage
$108,833
Interest Rate
6.94%
Mortgage Type
FHA
Create a Home Valuation Report for This Property
The Home Valuation Report is an in-depth analysis detailing your home's value as well as a comparison with similar homes in the area
Home Values in the Area
Average Home Value in this Area
Purchase History
| Date | Buyer | Sale Price | Title Company |
|---|---|---|---|
| Cao Phuoc Huu | -- | Amrock Llc | |
| Cao Phuoc Huu | -- | Fidelity National Title Co | |
| Cao Phuoc Huu | $140,000 | Fidelity National Title Co | |
| Wachovia Mortgage Fsb | $114,800 | None Available | |
| Capito Patricio D | -- | None Available | |
| Capito Patricio | $147,000 | Alliance Title Company | |
| Capito Patricio Delcarmen | $109,000 | Financial Title Company |
Source: Public Records
Mortgage History
| Date | Status | Borrower | Loan Amount |
|---|---|---|---|
| Open | Cao Phuoc Huu | $450,000 | |
| Closed | Cao Phuoc Huu | $112,000 | |
| Previous Owner | Capito Patricio | $294,000 | |
| Previous Owner | Capito Patricio Delcarmen | $108,833 |
Source: Public Records
Tax History Compared to Growth
Tax History
| Year | Tax Paid | Tax Assessment Tax Assessment Total Assessment is a certain percentage of the fair market value that is determined by local assessors to be the total taxable value of land and additions on the property. | Land | Improvement |
|---|---|---|---|---|
| 2025 | $4,244 | $173,273 | $54,082 | $126,191 |
| 2024 | $4,244 | $169,740 | $53,022 | $123,718 |
| 2023 | $4,079 | $173,274 | $51,982 | $121,292 |
| 2022 | $3,910 | $162,878 | $50,963 | $118,915 |
| 2021 | $3,608 | $159,547 | $49,964 | $116,583 |
| 2020 | $3,566 | $164,841 | $49,452 | $115,389 |
| 2019 | $3,350 | $161,610 | $48,483 | $113,127 |
| 2018 | $3,282 | $158,441 | $47,532 | $110,909 |
| 2017 | $3,125 | $155,334 | $46,600 | $108,734 |
| 2016 | $3,090 | $152,290 | $45,687 | $106,603 |
| 2015 | $3,238 | $150,004 | $45,001 | $105,003 |
| 2014 | $2,859 | $147,067 | $44,120 | $102,947 |
Source: Public Records
Map
Nearby Homes