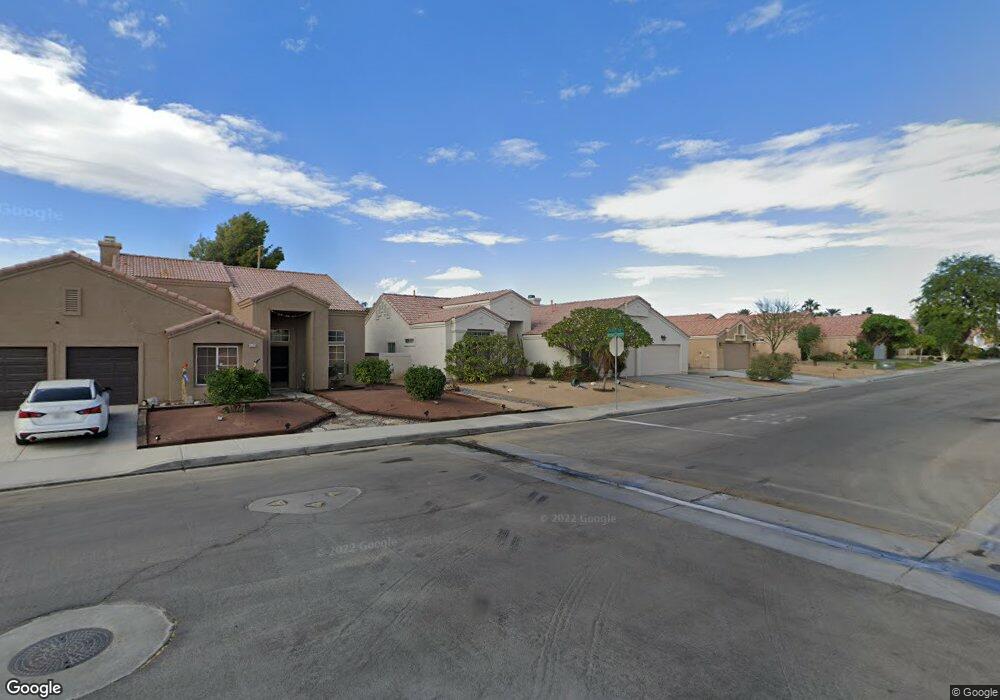
45215 Desert Air St La Quinta, CA 92253
Estimated Value: $393,000 - $641,000
4
Beds
3
Baths
2,060
Sq Ft
$277/Sq Ft
Est. Value
About This Home
This home is located at 45215 Desert Air St, La Quinta, CA 92253 and is currently estimated at $571,440, approximately $277 per square foot. 45215 Desert Air St is a home located in Riverside County with nearby schools including Amelia Earhart Elementary School Of International Studies, John Glenn Middle School Of International Studies, and La Quinta High School.
Ownership History
Date
Name
Owned For
Owner Type
Purchase Details
Closed on
Apr 2, 2013
Sold by
Fidone John L and Fidone Mary J
Bought by
Fidone John L and Fidone Mary J
Current Estimated Value
Home Financials for this Owner
Home Financials are based on the most recent Mortgage that was taken out on this home.
Original Mortgage
$457,500
Outstanding Balance
$323,517
Interest Rate
3.51%
Mortgage Type
Reverse Mortgage Home Equity Conversion Mortgage
Estimated Equity
$247,923
Purchase Details
Closed on
Nov 10, 2001
Sold by
Fidone John L and Fidone Mary J
Bought by
Fidone John L and Fidone Mary J
Purchase Details
Closed on
Aug 18, 1999
Sold by
Cus William M
Bought by
Fidone John L and Fidone Mary J
Purchase Details
Closed on
Jan 20, 1998
Sold by
Cus Antoinette Lisa
Bought by
Cus William M
Home Financials for this Owner
Home Financials are based on the most recent Mortgage that was taken out on this home.
Original Mortgage
$166,550
Interest Rate
7.05%
Create a Home Valuation Report for This Property
The Home Valuation Report is an in-depth analysis detailing your home's value as well as a comparison with similar homes in the area
Home Values in the Area
Average Home Value in this Area
Purchase History
| Date | Buyer | Sale Price | Title Company |
|---|---|---|---|
| Fidone John L | -- | Stewart Title | |
| Fidone John L | -- | -- | |
| Fidone John L | $210,000 | Stewart Title Co | |
| Cus William M | -- | American Title Co | |
| Cus William M | $175,500 | American Title Co |
Source: Public Records
Mortgage History
| Date | Status | Borrower | Loan Amount |
|---|---|---|---|
| Open | Fidone John L | $457,500 | |
| Previous Owner | Cus William M | $166,550 |
Source: Public Records
Tax History Compared to Growth
Tax History
| Year | Tax Paid | Tax Assessment Tax Assessment Total Assessment is a certain percentage of the fair market value that is determined by local assessors to be the total taxable value of land and additions on the property. | Land | Improvement |
|---|---|---|---|---|
| 2025 | $4,544 | $322,735 | $80,676 | $242,059 |
| 2024 | $4,544 | $316,408 | $79,095 | $237,313 |
| 2023 | $4,544 | $310,205 | $77,545 | $232,660 |
| 2022 | $4,253 | $304,123 | $76,024 | $228,099 |
| 2021 | $4,144 | $298,161 | $74,534 | $223,627 |
| 2020 | $4,070 | $295,104 | $73,770 | $221,334 |
| 2019 | $3,987 | $289,319 | $72,324 | $216,995 |
| 2018 | $3,900 | $283,647 | $70,907 | $212,740 |
| 2017 | $3,842 | $278,086 | $69,517 | $208,569 |
| 2016 | $3,772 | $272,634 | $68,154 | $204,480 |
| 2015 | $3,781 | $268,540 | $67,131 | $201,409 |
| 2014 | $3,722 | $263,281 | $65,817 | $197,464 |
Source: Public Records
Map
Nearby Homes
- 79305 Desert Wind Ct
- 79300 Desert Stream Dr
- 79389 Paseo Del Rey
- 44700 Calle Placido
- 45703 Crosswater St
- 79030 Ladera Dr
- 79385 Avenida Las Palmas
- 44800 Calle Santa Barbara
- 45623 Green Hills Ct
- 79185 Canterra Cir
- 79533 Morning Glory Ct
- 79528 Morning Glory Ct
- 45905 Crosswater St
- 79541 Morning Glory Ct
- 79573 Carmel Valley Ave
- 80367 Segovia View Way
- 58132 Aragon Way
- 79624 Morning Glory Ct
- 78670 Bradford Cir
- 78640 Alden Cir
- 45245 Desert Air St
- 45185 Desert Air St
- 45100 Bridgette Way
- 45080 Bridgette Way
- 45120 Bridgette Way
- 45155 Desert Air St
- 45275 Desert Air St
- 45210 Desert Air St
- 45070 Bridgette Way
- 45180 Desert Air St
- 45140 Bridgette Way
- 45150 Desert Air St
- 45060 Bridgette Way
- 45125 Desert Air St
- 45305 Desert Air St
- 79285 Desert Crest Dr Unit D
- 79285 Desert Crest Dr
- 45160 Bridgette Way
- 45215 Desert View Ct
- 79245 Diane Dr