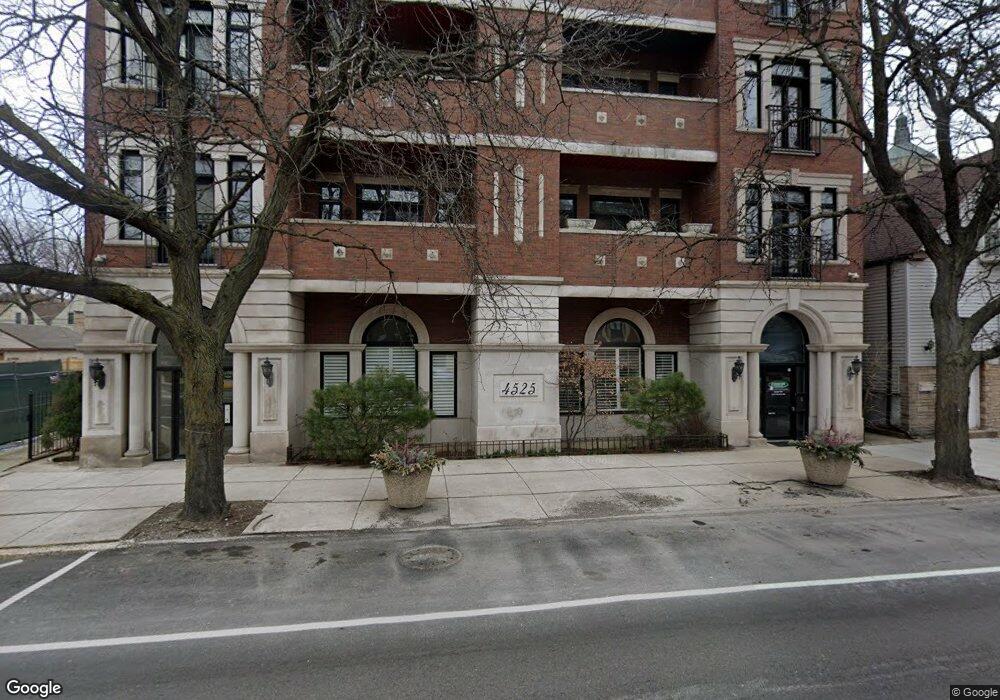
4525 N Western Ave Unit 3C Chicago, IL 60625
Ravenswood NeighborhoodEstimated Value: $704,000 - $848,000
3
Beds
3
Baths
2,000
Sq Ft
$383/Sq Ft
Est. Value
About This Home
This home is located at 4525 N Western Ave Unit 3C, Chicago, IL 60625 and is currently estimated at $765,718, approximately $382 per square foot. 4525 N Western Ave Unit 3C is a home located in Cook County with nearby schools including Waters Elementary School, Amundsen High School, and Queen Of Angels Elementary School.
Ownership History
Date
Name
Owned For
Owner Type
Purchase Details
Closed on
Feb 24, 2017
Sold by
Laskaris Evan and Laskaris Maureen
Bought by
Misetic Kresimir and Misetic Antonia
Current Estimated Value
Purchase Details
Closed on
May 7, 2007
Sold by
Gregory Jonathan H and Gregory Sally W
Bought by
Laskaris Evan G and Laskaris Maureen
Home Financials for this Owner
Home Financials are based on the most recent Mortgage that was taken out on this home.
Original Mortgage
$417,000
Interest Rate
6.22%
Mortgage Type
Purchase Money Mortgage
Purchase Details
Closed on
Jan 25, 2006
Sold by
Standard Bank & Trust Co
Bought by
Gregory Jonathan H and Gregory Sally W
Home Financials for this Owner
Home Financials are based on the most recent Mortgage that was taken out on this home.
Original Mortgage
$448,000
Interest Rate
5.62%
Mortgage Type
Fannie Mae Freddie Mac
Create a Home Valuation Report for This Property
The Home Valuation Report is an in-depth analysis detailing your home's value as well as a comparison with similar homes in the area
Home Values in the Area
Average Home Value in this Area
Purchase History
| Date | Buyer | Sale Price | Title Company |
|---|---|---|---|
| Misetic Kresimir | $560,000 | Proper Title Llc | |
| Laskaris Evan G | $592,000 | Stewart Title Of Illinois | |
| Gregory Jonathan H | $560,000 | Premier Title |
Source: Public Records
Mortgage History
| Date | Status | Borrower | Loan Amount |
|---|---|---|---|
| Previous Owner | Laskaris Evan G | $417,000 | |
| Previous Owner | Gregory Jonathan H | $448,000 |
Source: Public Records
Tax History Compared to Growth
Tax History
| Year | Tax Paid | Tax Assessment Tax Assessment Total Assessment is a certain percentage of the fair market value that is determined by local assessors to be the total taxable value of land and additions on the property. | Land | Improvement |
|---|---|---|---|---|
| 2024 | $10,189 | $68,186 | $12,894 | $55,292 |
| 2023 | $10,182 | $56,400 | $11,013 | $45,387 |
| 2022 | $10,182 | $56,400 | $11,013 | $45,387 |
| 2021 | $9,758 | $56,399 | $11,013 | $45,386 |
| 2020 | $10,217 | $49,514 | $5,550 | $43,964 |
| 2019 | $10,121 | $54,424 | $5,550 | $48,874 |
| 2018 | $9,934 | $54,424 | $5,550 | $48,874 |
| 2017 | $8,177 | $39,874 | $4,856 | $35,018 |
| 2016 | $7,804 | $39,874 | $4,856 | $35,018 |
| 2015 | $7,070 | $39,874 | $4,856 | $35,018 |
| 2014 | $5,642 | $31,905 | $3,729 | $28,176 |
| 2013 | $5,519 | $31,905 | $3,729 | $28,176 |
Source: Public Records
Map
Nearby Homes
- 4519 N Western Ave
- 2224 W Eastwood Ave
- 2321 W Montrose Ave
- 2455 W Leland Ave Unit 1
- 2163 W Windsor Ave
- 4333 N Oakley Ave
- 4751 N Artesian Ave Unit 205
- 2461 W Pensacola Ave
- 2135 W Leland Ave
- 2608 W Leland Ave Unit 3
- 2617 W Leland Ave Unit 1
- 2034 W Sunnyside Ave
- 4444 N Damen Ave Unit 4E
- 2248 W Ainslie St
- 2468 W Berteau Ave
- 4755 N Washtenaw Ave Unit P-27
- 4755 N Washtenaw Ave Unit P-11
- 4755 N Washtenaw Ave Unit P-25
- 4154 N Campbell Ave
- 2709 W Lawrence Ave Unit 3
- 4525 N Western Ave Unit 4B
- 4525 N Western Ave Unit 4A
- 4525 N Western Ave Unit 3B
- 4525 N Western Ave Unit 3A
- 4525 N Western Ave Unit 2C
- 4525 N Western Ave Unit 2B
- 4525 N Western Ave Unit 2A
- 4525 N Western Ave Unit C
- 4525 N Western Ave Unit 3L
- 4529 N Western Ave Unit 2
- 4529 N Western Ave
- 4519 N Western Ave Unit 1
- 4531 N Western Ave
- 4533 N Western Ave
- 4515 N Western Ave
- 4535 N Western Ave
- 4513 N Western Ave
- 4539 N Western Ave
- 4524 N Claremont Ave
- 4524 N Claremont Ave