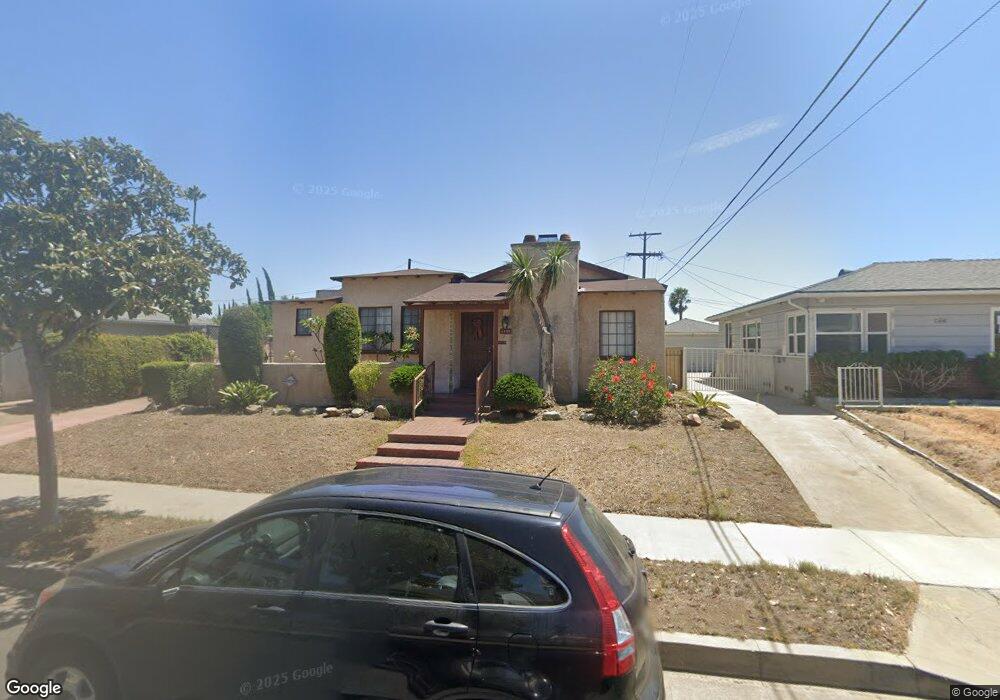
4530 Orchid Dr Los Angeles, CA 90043
View Park NeighborhoodEstimated Value: $1,101,000 - $1,235,000
4
Beds
3
Baths
1,876
Sq Ft
$625/Sq Ft
Est. Value
About This Home
This home is located at 4530 Orchid Dr, Los Angeles, CA 90043 and is currently estimated at $1,171,829, approximately $624 per square foot. 4530 Orchid Dr is a home located in Los Angeles County with nearby schools including Windsor Hills Math Science, Audubon Middle School, and Crenshaw Science, Technology, Engineering, Math And Medicine Magnet.
Ownership History
Date
Name
Owned For
Owner Type
Purchase Details
Closed on
Jul 27, 2023
Sold by
Garrett Daisy
Bought by
Garrett Daisy and Garrett Monet
Current Estimated Value
Purchase Details
Closed on
Apr 25, 2007
Sold by
Garrett Daisy Cameron
Bought by
Garrett Daisy Cameron and Garrett Living Trust
Home Financials for this Owner
Home Financials are based on the most recent Mortgage that was taken out on this home.
Original Mortgage
$460,000
Interest Rate
5.75%
Mortgage Type
New Conventional
Purchase Details
Closed on
Apr 18, 2006
Sold by
Garrett Daisy E
Bought by
Garrett Daisy F and Garrett Living Trust
Purchase Details
Closed on
Apr 11, 2002
Sold by
Garrett Moise S
Bought by
Garrett Daisy E
Home Financials for this Owner
Home Financials are based on the most recent Mortgage that was taken out on this home.
Original Mortgage
$215,500
Interest Rate
6.78%
Purchase Details
Closed on
Oct 26, 1998
Sold by
Garrett Daisy E
Bought by
Garrett Daisy E and Garrett Moise S
Create a Home Valuation Report for This Property
The Home Valuation Report is an in-depth analysis detailing your home's value as well as a comparison with similar homes in the area
Home Values in the Area
Average Home Value in this Area
Purchase History
| Date | Buyer | Sale Price | Title Company |
|---|---|---|---|
| Garrett Daisy | -- | None Listed On Document | |
| Garrett Daisy Cameron | -- | Transunion | |
| Garrett Daisy F | -- | None Available | |
| Garrett Daisy E | -- | Commerce Title | |
| Garrett Daisy E | -- | -- |
Source: Public Records
Mortgage History
| Date | Status | Borrower | Loan Amount |
|---|---|---|---|
| Previous Owner | Garrett Daisy Cameron | $460,000 | |
| Previous Owner | Garrett Daisy E | $215,500 |
Source: Public Records
Tax History Compared to Growth
Tax History
| Year | Tax Paid | Tax Assessment Tax Assessment Total Assessment is a certain percentage of the fair market value that is determined by local assessors to be the total taxable value of land and additions on the property. | Land | Improvement |
|---|---|---|---|---|
| 2025 | $2,673 | $163,578 | $42,137 | $121,441 |
| 2024 | $2,673 | $160,371 | $41,311 | $119,060 |
| 2023 | $2,635 | $157,227 | $40,501 | $116,726 |
| 2022 | $2,535 | $154,145 | $39,707 | $114,438 |
| 2021 | $2,502 | $151,124 | $38,929 | $112,195 |
| 2019 | $2,435 | $146,643 | $37,775 | $108,868 |
| 2018 | $2,325 | $143,769 | $37,035 | $106,734 |
| 2016 | $2,216 | $138,189 | $35,598 | $102,591 |
| 2015 | $2,184 | $136,114 | $35,064 | $101,050 |
| 2014 | $2,188 | $133,449 | $34,378 | $99,071 |
Source: Public Records
Map
Nearby Homes
- 5909 Overhill Dr
- 4440 W 58th Place
- 5549 Onacrest Dr
- 6005 S La Brea Ave
- 6006 Overhill Dr
- 4408 W 59th St
- 4329 W 58th Place
- 4325 W 58th Place
- 4313 W 59th St
- 4472 W 62nd St
- 4470 W 62nd St
- 4263 W 59th St
- 4254 W 58th Place
- 4243 W 58th Place
- 5918 S Fairfax Ave
- 5452 Harcross Dr
- 4516 W 63rd St
- 5659 Valley Glen Way
- 4581 Northridge Dr
- 6111 S Fairfax Ave
- 4538 Orchid Dr
- 5857 S Citrus Ave
- 5867 S Citrus Ave
- 4550 Orchid Dr
- 4568 Orchid Dr
- 4533 Orchid Dr
- 5875 S Citrus Ave
- 4537 Orchid Dr
- 4527 Orchid Dr
- 4570 Orchid Dr
- 4545 Orchid Dr
- 4521 Orchid Dr
- 4576 Orchid Dr
- 5858 S Citrus Ave
- 5907 S Citrus Ave
- 5864 S Citrus Ave
- 4547 Orchid Dr
- 4517 Orchid Dr
- 5852 S Citrus Ave
- 5870 S Citrus Ave