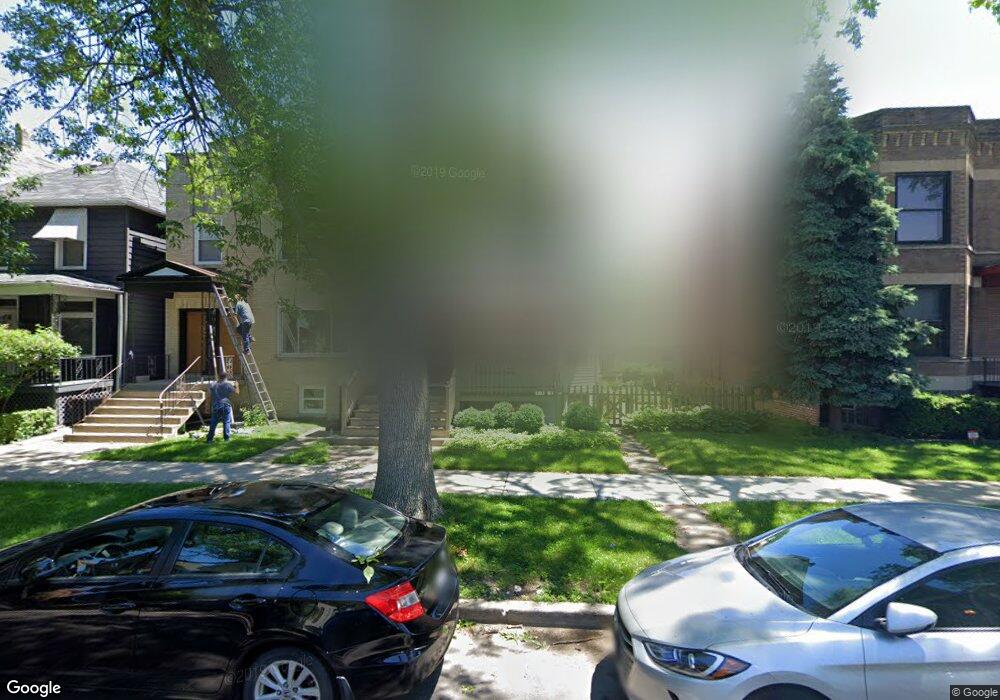
4535 N Claremont Ave Chicago, IL 60625
Ravenswood NeighborhoodEstimated Value: $1,026,000 - $1,183,000
4
Beds
3
Baths
2,052
Sq Ft
$537/Sq Ft
Est. Value
About This Home
This home is located at 4535 N Claremont Ave, Chicago, IL 60625 and is currently estimated at $1,102,507, approximately $537 per square foot. 4535 N Claremont Ave is a home located in Cook County with nearby schools including Waters Elementary School, Amundsen High School, and Queen Of Angels Elementary School.
Ownership History
Date
Name
Owned For
Owner Type
Purchase Details
Closed on
Oct 30, 2024
Sold by
Orr Glenn E and Obrien Helen
Bought by
Glenn Edward Orr Revocable Trust and Helen Maureen Obrien Revocable Trust
Current Estimated Value
Purchase Details
Closed on
Sep 30, 1999
Sold by
Rosenblum Steven J and Rosenbaum Laura B
Bought by
Orr Glenn E and Obrien Helen
Home Financials for this Owner
Home Financials are based on the most recent Mortgage that was taken out on this home.
Original Mortgage
$328,000
Interest Rate
7.82%
Purchase Details
Closed on
May 1, 1996
Sold by
Commercial National Bank Of Chicago
Bought by
Rosenblum Steven J and Rosenblum Laura B
Home Financials for this Owner
Home Financials are based on the most recent Mortgage that was taken out on this home.
Original Mortgage
$199,500
Interest Rate
8.13%
Create a Home Valuation Report for This Property
The Home Valuation Report is an in-depth analysis detailing your home's value as well as a comparison with similar homes in the area
Home Values in the Area
Average Home Value in this Area
Purchase History
| Date | Buyer | Sale Price | Title Company |
|---|---|---|---|
| Glenn Edward Orr Revocable Trust | -- | None Listed On Document | |
| Glenn Edward Orr Revocable Trust | -- | None Listed On Document | |
| Orr Glenn E | $410,000 | -- | |
| Rosenblum Steven J | $145,000 | -- |
Source: Public Records
Mortgage History
| Date | Status | Borrower | Loan Amount |
|---|---|---|---|
| Previous Owner | Orr Glenn E | $328,000 | |
| Previous Owner | Rosenblum Steven J | $199,500 |
Source: Public Records
Tax History Compared to Growth
Tax History
| Year | Tax Paid | Tax Assessment Tax Assessment Total Assessment is a certain percentage of the fair market value that is determined by local assessors to be the total taxable value of land and additions on the property. | Land | Improvement |
|---|---|---|---|---|
| 2024 | $15,993 | $102,349 | $51,848 | $50,501 |
| 2023 | $16,772 | $79,114 | $41,850 | $37,264 |
| 2022 | $16,772 | $84,963 | $41,850 | $43,113 |
| 2021 | $17,464 | $90,175 | $41,850 | $48,325 |
| 2020 | $17,270 | $80,626 | $22,320 | $58,306 |
| 2019 | $17,112 | $88,600 | $22,320 | $66,280 |
| 2018 | $16,823 | $88,600 | $22,320 | $66,280 |
| 2017 | $10,705 | $53,102 | $19,530 | $33,572 |
| 2016 | $10,136 | $53,102 | $19,530 | $33,572 |
| 2015 | $10,307 | $58,870 | $19,530 | $39,340 |
| 2014 | $7,930 | $45,309 | $14,880 | $30,429 |
| 2013 | $7,762 | $45,309 | $14,880 | $30,429 |
Source: Public Records
Map
Nearby Homes
- 4519 N Western Ave
- 2224 W Eastwood Ave
- 2163 W Windsor Ave
- 2321 W Montrose Ave
- 4333 N Oakley Ave
- 2455 W Leland Ave Unit 1
- 2135 W Leland Ave
- 4751 N Artesian Ave Unit 205
- 2034 W Sunnyside Ave
- 2461 W Pensacola Ave
- 2608 W Leland Ave Unit 3
- 2617 W Leland Ave Unit 1
- 2248 W Ainslie St
- 4814 N Damen Ave Unit 209
- 4726 N Winchester Ave Unit C
- 4726 N Winchester Ave Unit F
- 4938 N Bell Ave
- 2468 W Berteau Ave
- 4425 N Winchester Ave
- 2107 W Berteau Ave
- 4539 N Claremont Ave
- 4539 N Claremont Ave
- 4531 N Claremont Ave
- 4541 N Claremont Ave
- 4529 N Claremont Ave
- 4525 N Claremont Ave
- 4525 N Claremont Ave
- 4525 N Claremont Ave Unit 2F
- 4547 N Claremont Ave Unit 2
- 4547 N Claremont Ave
- 4549 N Claremont Ave
- 4549 N Claremont Ave
- 4534 N Oakley Ave
- 4538 N Oakley Ave Unit 2
- 4521 N Claremont Ave
- 4521 N Claremont Ave
- 4521 N Claremont Ave Unit 1F
- 4521 N Claremont Ave Unit 2R
- 4521 N Claremont Ave Unit 2F
- 4528 N Oakley Ave