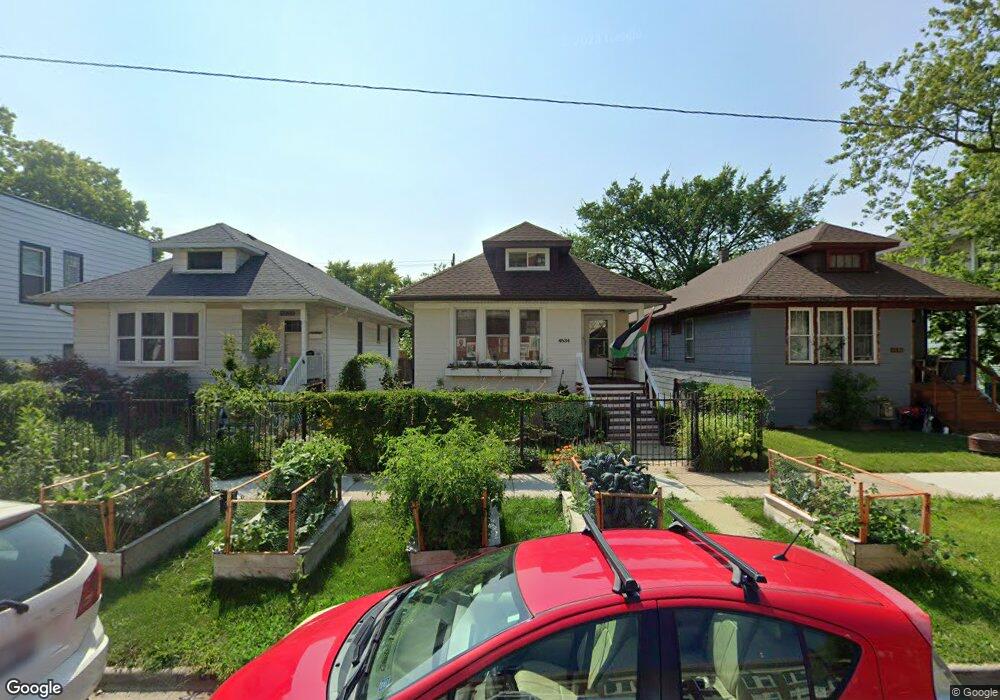
4536 N Avers Ave Chicago, IL 60625
Albany Park NeighborhoodEstimated Value: $337,000 - $485,000
2
Beds
1
Bath
1,013
Sq Ft
$413/Sq Ft
Est. Value
About This Home
This home is located at 4536 N Avers Ave, Chicago, IL 60625 and is currently estimated at $418,406, approximately $413 per square foot. 4536 N Avers Ave is a home located in Cook County with nearby schools including Haugan Elementary School, Roosevelt High School, and ASPIRA Haugan Middle School.
Ownership History
Date
Name
Owned For
Owner Type
Purchase Details
Closed on
Jul 22, 2022
Sold by
Rosales Julio R and Rosales Marina A
Bought by
Gutoske Ellen and Kelley Joseph
Current Estimated Value
Home Financials for this Owner
Home Financials are based on the most recent Mortgage that was taken out on this home.
Original Mortgage
$343,660
Outstanding Balance
$326,697
Interest Rate
5%
Mortgage Type
FHA
Estimated Equity
$91,709
Purchase Details
Closed on
Jun 25, 1998
Sold by
Cuevas Jose and Tirado Nydia
Bought by
Rosales Julio R and Rosales Marina A
Home Financials for this Owner
Home Financials are based on the most recent Mortgage that was taken out on this home.
Original Mortgage
$124,949
Interest Rate
7.18%
Mortgage Type
FHA
Purchase Details
Closed on
May 29, 1997
Sold by
Sayles Frank W and Partenski Ronald R
Bought by
Cuevas Jose and Tirado Nydia
Home Financials for this Owner
Home Financials are based on the most recent Mortgage that was taken out on this home.
Original Mortgage
$111,912
Interest Rate
8.17%
Mortgage Type
FHA
Create a Home Valuation Report for This Property
The Home Valuation Report is an in-depth analysis detailing your home's value as well as a comparison with similar homes in the area
Home Values in the Area
Average Home Value in this Area
Purchase History
| Date | Buyer | Sale Price | Title Company |
|---|---|---|---|
| Gutoske Ellen | $350,000 | First American Title | |
| Rosales Julio R | $127,000 | Professional National Title | |
| Cuevas Jose | $112,000 | -- |
Source: Public Records
Mortgage History
| Date | Status | Borrower | Loan Amount |
|---|---|---|---|
| Open | Gutoske Ellen | $343,660 | |
| Previous Owner | Rosales Julio R | $124,949 | |
| Previous Owner | Cuevas Jose | $111,912 |
Source: Public Records
Tax History Compared to Growth
Tax History
| Year | Tax Paid | Tax Assessment Tax Assessment Total Assessment is a certain percentage of the fair market value that is determined by local assessors to be the total taxable value of land and additions on the property. | Land | Improvement |
|---|---|---|---|---|
| 2024 | $6,286 | $38,001 | $14,438 | $23,563 |
| 2023 | $5,541 | $33,000 | $11,550 | $21,450 |
| 2022 | $5,541 | $33,000 | $11,550 | $21,450 |
| 2021 | $3,411 | $33,000 | $11,550 | $21,450 |
| 2020 | $3,521 | $24,369 | $5,981 | $18,388 |
| 2019 | $3,510 | $27,381 | $5,981 | $21,400 |
| 2018 | $3,456 | $27,381 | $5,981 | $21,400 |
| 2017 | $5,298 | $24,532 | $5,362 | $19,170 |
| 2016 | $4,070 | $24,532 | $5,362 | $19,170 |
| 2015 | $4,029 | $24,532 | $5,362 | $19,170 |
| 2014 | $4,083 | $24,493 | $4,950 | $19,543 |
| 2013 | $3,991 | $24,493 | $4,950 | $19,543 |
Source: Public Records
Map
Nearby Homes
- 4515 N Hamlin Ave
- 4602 N Springfield Ave
- 4614 N Springfield Ave
- 4624 N Springfield Ave
- 4461 N Pulaski Rd
- 3816 W Montrose Ave
- 4619 N Lawndale Ave Unit 1
- 4533 N Karlov Ave
- 4515 N Karlov Ave
- 4731 N Keystone Ave
- 4621 N Monticello Ave
- 4387 N Elston Ave
- 4101 W Montrose Ave
- 4545 N Kedvale Ave
- 4304 N Lawndale Ave
- 4109 W Eastwood Ave Unit 2
- 3711 W Lawrence Ave
- 3707 W Cullom Ave Unit 1
- 4337 N Kedvale Ave Unit 206
- 4337 N Kedvale Ave Unit 2E
- 4534 N Avers Ave
- 4538 N Avers Ave
- 4530 N Avers Ave
- 4540 N Avers Ave
- 4526 N Avers Ave
- 4526 N Avers Ave Unit 2
- 4544 N Avers Ave
- 4524 N Avers Ave Unit 1
- 4520 N Avers Ave
- 4520 N Avers Ave
- 4520 N Avers Ave Unit 2
- 4548 N Avers Ave
- 4535 N Springfield Ave
- 4533 N Springfield Ave
- 4537 N Springfield Ave
- 4529 N Springfield Ave
- 4541 N Springfield Ave
- 4518 N Avers Ave
- 4545 N Springfield Ave
- 4550 N Avers Ave Unit 1