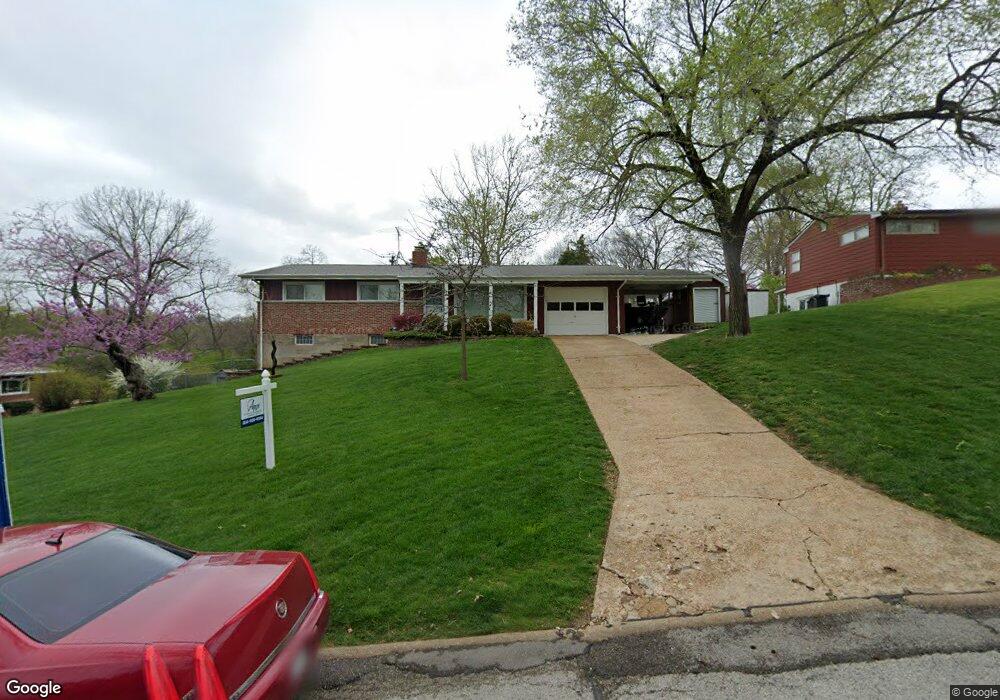
4537 Jenkins Ln Saint Louis, MO 63128
Estimated Value: $289,349 - $314,000
3
Beds
2
Baths
1,148
Sq Ft
$260/Sq Ft
Est. Value
About This Home
This home is located at 4537 Jenkins Ln, Saint Louis, MO 63128 and is currently estimated at $298,837, approximately $260 per square foot. 4537 Jenkins Ln is a home located in St. Louis County with nearby schools including Kennerly Elementary School, Sperreng Middle School, and Lindbergh High School.
Ownership History
Date
Name
Owned For
Owner Type
Purchase Details
Closed on
Aug 31, 2021
Sold by
Fitzwater Carl D
Bought by
Fitzwater Carl D and King Dotty Louise
Current Estimated Value
Purchase Details
Closed on
Dec 29, 2009
Sold by
Foster Loren D and Foster Loren D
Bought by
Fitzwater Carl D
Home Financials for this Owner
Home Financials are based on the most recent Mortgage that was taken out on this home.
Original Mortgage
$151,276
Interest Rate
5.25%
Mortgage Type
FHA
Purchase Details
Closed on
Apr 12, 2004
Sold by
Fuerst Gary R and Fuerst Peggy M
Bought by
Foster Loren D and Foster Loren D
Home Financials for this Owner
Home Financials are based on the most recent Mortgage that was taken out on this home.
Original Mortgage
$162,450
Interest Rate
5.61%
Mortgage Type
FHA
Create a Home Valuation Report for This Property
The Home Valuation Report is an in-depth analysis detailing your home's value as well as a comparison with similar homes in the area
Home Values in the Area
Average Home Value in this Area
Purchase History
| Date | Buyer | Sale Price | Title Company |
|---|---|---|---|
| Fitzwater Carl D | -- | None Available | |
| Fitzwater Carl D | -- | None Listed On Document | |
| Fitzwater Carl D | $156,500 | None Available | |
| Foster Loren D | $165,000 | -- |
Source: Public Records
Mortgage History
| Date | Status | Borrower | Loan Amount |
|---|---|---|---|
| Previous Owner | Fitzwater Carl D | $151,276 | |
| Previous Owner | Foster Loren D | $162,450 |
Source: Public Records
Tax History Compared to Growth
Tax History
| Year | Tax Paid | Tax Assessment Tax Assessment Total Assessment is a certain percentage of the fair market value that is determined by local assessors to be the total taxable value of land and additions on the property. | Land | Improvement |
|---|---|---|---|---|
| 2025 | $3,092 | $52,900 | $18,910 | $33,990 |
| 2024 | $3,092 | $47,430 | $21,000 | $26,430 |
| 2023 | $3,092 | $44,390 | $21,000 | $23,390 |
| 2022 | $2,883 | $42,530 | $21,000 | $21,530 |
| 2021 | $2,781 | $42,530 | $21,000 | $21,530 |
| 2020 | $2,481 | $36,560 | $18,070 | $18,490 |
| 2019 | $2,474 | $36,560 | $18,070 | $18,490 |
| 2018 | $2,233 | $29,980 | $11,210 | $18,770 |
| 2017 | $2,209 | $29,980 | $11,210 | $18,770 |
| 2016 | $2,239 | $28,860 | $10,090 | $18,770 |
| 2015 | $2,205 | $28,860 | $10,090 | $18,770 |
| 2014 | $2,160 | $27,990 | $7,300 | $20,690 |
Source: Public Records
Map
Nearby Homes
- 4449 Pinyon Jay Ct
- 4818 Chapel Hill Dr
- 4829 Vermilion Dr
- 4931 Theiss Rd
- 4643 Littlebury Dr
- 4645 Tauneybrook Dr
- 4838 Dorsie Dr
- 12055 Charwick Dr
- 4849 Gatesbury Dr
- 12015 Charwick Dr
- 4700 Theiss Rd
- 11862 E Concord Rd
- 4642 Theiss Rd
- 4839 Hursley Dr
- 4833 Hursley Dr
- 4740 Hedgemont Dr
- 4801 Langtree Dr
- 25 Fawnwood Dr
- 4501 Eli Dr Unit I
- 4525 Eli Dr Unit D
- 4545 Jenkins Ln
- 4923 Saint Gemme Ln
- 4900 Mount Royal Rd
- 4915 Saint Gemme Ln
- 4532 Jenkins Ln
- 4914 Mount Royal Rd
- 4542 Jenkins Ln
- 4901 Saint Gemme Ln
- 4522 Jenkins Ln
- 4922 Mount Royal Rd
- 4931 Saint Gemme Ln
- 4552 Jenkins Ln
- 4930 Mount Royal Rd
- 4895 Vermilion Dr
- 4512 Jenkins Ln
- 4901 Mount Royal Rd
- 4896 Vermilion Dr
- 4945 Saint Gemme Ln
- 4515 Towhee Ct