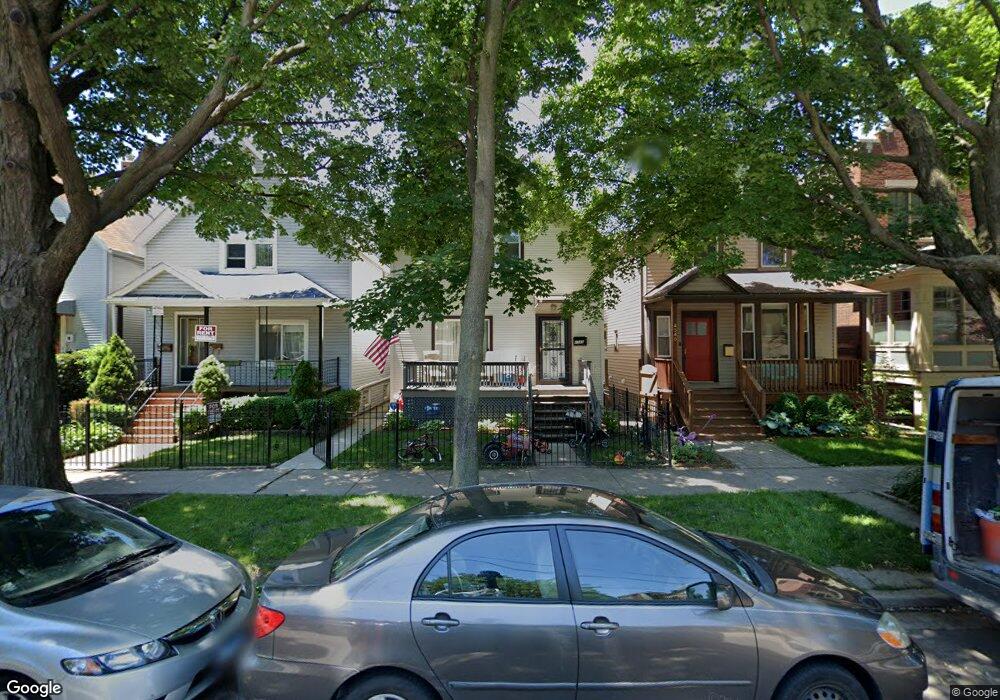
4542 N Oakley Ave Chicago, IL 60625
Ravenswood NeighborhoodEstimated Value: $813,000 - $940,000
3
Beds
3
Baths
1,451
Sq Ft
$600/Sq Ft
Est. Value
About This Home
This home is located at 4542 N Oakley Ave, Chicago, IL 60625 and is currently estimated at $870,894, approximately $600 per square foot. 4542 N Oakley Ave is a home located in Cook County with nearby schools including Waters Elementary School, Amundsen High School, and Queen Of Angels Elementary School.
Ownership History
Date
Name
Owned For
Owner Type
Purchase Details
Closed on
Oct 30, 2013
Sold by
Smith David A
Bought by
Karalus James and Waegenaere Jill
Current Estimated Value
Home Financials for this Owner
Home Financials are based on the most recent Mortgage that was taken out on this home.
Original Mortgage
$50,900
Interest Rate
3.25%
Mortgage Type
Credit Line Revolving
Purchase Details
Closed on
May 24, 2007
Sold by
Smith David A
Bought by
Smith David A and David A Smith Trust
Purchase Details
Closed on
Jan 30, 1998
Sold by
Kuang Tan Shirley and Kuang Albert Li Chao
Bought by
Smith David
Home Financials for this Owner
Home Financials are based on the most recent Mortgage that was taken out on this home.
Original Mortgage
$158,850
Interest Rate
7.16%
Purchase Details
Closed on
Jun 15, 1995
Sold by
Campos Fernando and Campos Concepcion
Bought by
Kuang Tan Shirley and Kuang Albert Li Chao
Create a Home Valuation Report for This Property
The Home Valuation Report is an in-depth analysis detailing your home's value as well as a comparison with similar homes in the area
Home Values in the Area
Average Home Value in this Area
Purchase History
| Date | Buyer | Sale Price | Title Company |
|---|---|---|---|
| Karalus James | $510,000 | Pntn | |
| Smith David A | -- | None Available | |
| Smith David | $196,500 | Chicago Title Insurance Co | |
| Kuang Tan Shirley | $142,000 | -- |
Source: Public Records
Mortgage History
| Date | Status | Borrower | Loan Amount |
|---|---|---|---|
| Closed | Karalus James | $50,900 | |
| Previous Owner | Smith David | $158,850 |
Source: Public Records
Tax History Compared to Growth
Tax History
| Year | Tax Paid | Tax Assessment Tax Assessment Total Assessment is a certain percentage of the fair market value that is determined by local assessors to be the total taxable value of land and additions on the property. | Land | Improvement |
|---|---|---|---|---|
| 2024 | $11,080 | $67,633 | $34,565 | $33,068 |
| 2023 | $10,780 | $55,832 | $27,900 | $27,932 |
| 2022 | $10,780 | $55,832 | $27,900 | $27,932 |
| 2021 | $10,557 | $55,831 | $27,900 | $27,931 |
| 2020 | $11,841 | $56,256 | $14,880 | $41,376 |
| 2019 | $11,731 | $61,820 | $14,880 | $46,940 |
| 2018 | $11,533 | $61,820 | $14,880 | $46,940 |
| 2017 | $9,370 | $46,901 | $13,020 | $33,881 |
| 2016 | $9,870 | $49,280 | $13,020 | $36,260 |
| 2015 | $9,030 | $49,280 | $13,020 | $36,260 |
| 2014 | $7,777 | $41,915 | $9,920 | $31,995 |
| 2013 | $8,123 | $47,291 | $9,920 | $37,371 |
Source: Public Records
Map
Nearby Homes
- 4519 N Western Ave
- 2224 W Eastwood Ave
- 2163 W Windsor Ave
- 2321 W Montrose Ave
- 4333 N Oakley Ave
- 2455 W Leland Ave Unit 1
- 2135 W Leland Ave
- 4751 N Artesian Ave Unit 205
- 2034 W Sunnyside Ave
- 2461 W Pensacola Ave
- 2608 W Leland Ave Unit 3
- 2617 W Leland Ave Unit 1
- 2248 W Ainslie St
- 4814 N Damen Ave Unit 209
- 4726 N Winchester Ave Unit C
- 4726 N Winchester Ave Unit F
- 4938 N Bell Ave
- 2468 W Berteau Ave
- 4425 N Winchester Ave
- 2107 W Berteau Ave
- 4546 N Oakley Ave
- 4548 N Oakley Ave
- 4550 N Oakley Ave
- 4550 N Oakley Ave
- 4540 N Oakley Ave
- 4538 N Oakley Ave Unit 2
- 2309 W Wilson Ave
- 2305 W Wilson Ave
- 2305 W Wilson Ave
- 2305 W Wilson Ave Unit 3F
- 2311 W Wilson Ave
- 2311 W Wilson Ave Unit A07K
- 2311 W Wilson Ave Unit J09W
- 2311 W Wilson Ave Unit 1
- 4534 N Oakley Ave
- 2306 W Wilson Ave
- 2306 W Wilson Ave Unit 3
- 2306 W Wilson Ave Unit 2
- 4530 N Oakley Ave
- 4549 N Claremont Ave