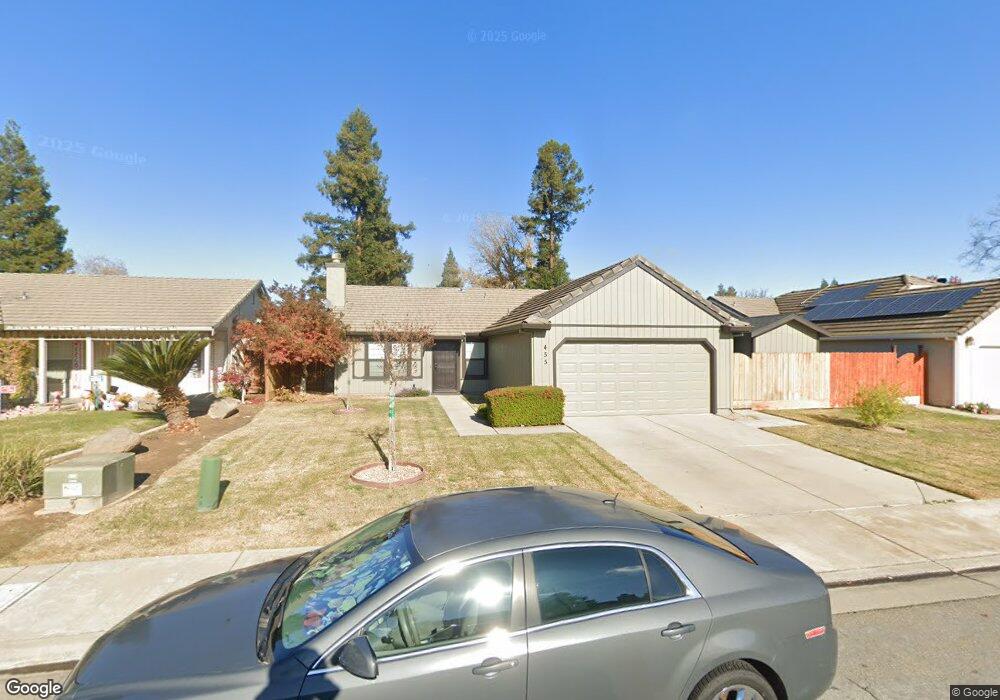
455 El Portal Ct Merced, CA 95348
North Merced NeighborhoodEstimated Value: $357,021 - $386,000
3
Beds
2
Baths
1,440
Sq Ft
$259/Sq Ft
Est. Value
About This Home
This home is located at 455 El Portal Ct, Merced, CA 95348 and is currently estimated at $372,505, approximately $258 per square foot. 455 El Portal Ct is a home located in Merced County with nearby schools including Allan Peterson Elementary School, Herbert H. Cruickshank Middle School, and Merced High School.
Ownership History
Date
Name
Owned For
Owner Type
Purchase Details
Closed on
Feb 10, 2000
Sold by
Hud
Bought by
Cox Kathy Ellen
Current Estimated Value
Home Financials for this Owner
Home Financials are based on the most recent Mortgage that was taken out on this home.
Original Mortgage
$89,862
Outstanding Balance
$29,489
Interest Rate
8.06%
Mortgage Type
FHA
Estimated Equity
$343,016
Purchase Details
Closed on
Sep 13, 1999
Sold by
Countrywide Home Loans Inc
Bought by
Hud
Purchase Details
Closed on
Aug 7, 1997
Sold by
Walker Eleanore F and Hartman Joseph T
Bought by
Saechao Ket and Saecho Yen
Home Financials for this Owner
Home Financials are based on the most recent Mortgage that was taken out on this home.
Original Mortgage
$93,047
Interest Rate
7.43%
Mortgage Type
FHA
Purchase Details
Closed on
Mar 5, 1997
Sold by
Rhodes John C and Rhodes Sherrie L
Bought by
Walker Eleanore F and Hartman Joseph T
Create a Home Valuation Report for This Property
The Home Valuation Report is an in-depth analysis detailing your home's value as well as a comparison with similar homes in the area
Home Values in the Area
Average Home Value in this Area
Purchase History
| Date | Buyer | Sale Price | Title Company |
|---|---|---|---|
| Cox Kathy Ellen | $90,000 | North American Title Co | |
| Hud | -- | First American Title Ins Co | |
| Countrywide Home Loans Inc | $101,270 | First American Title Ins Co | |
| Saechao Ket | $95,000 | Transcounty Title | |
| Walker Eleanore F | -- | Transcounty Title |
Source: Public Records
Mortgage History
| Date | Status | Borrower | Loan Amount |
|---|---|---|---|
| Open | Cox Kathy Ellen | $89,862 | |
| Previous Owner | Saechao Ket | $93,047 | |
| Closed | Saechao Ket | $9,920 |
Source: Public Records
Tax History Compared to Growth
Tax History
| Year | Tax Paid | Tax Assessment Tax Assessment Total Assessment is a certain percentage of the fair market value that is determined by local assessors to be the total taxable value of land and additions on the property. | Land | Improvement |
|---|---|---|---|---|
| 2025 | $1,430 | $138,302 | $46,096 | $92,206 |
| 2024 | $1,430 | $135,592 | $45,193 | $90,399 |
| 2023 | $1,408 | $132,934 | $44,307 | $88,627 |
| 2022 | $1,385 | $130,329 | $43,439 | $86,890 |
| 2021 | $1,377 | $127,775 | $42,588 | $85,187 |
| 2020 | $1,386 | $126,466 | $42,152 | $84,314 |
| 2019 | $1,363 | $123,987 | $41,326 | $82,661 |
| 2018 | $1,243 | $121,557 | $40,516 | $81,041 |
| 2017 | $1,287 | $119,174 | $39,722 | $79,452 |
| 2016 | $1,265 | $116,839 | $38,944 | $77,895 |
| 2015 | $1,244 | $115,085 | $38,360 | $76,725 |
| 2014 | $1,216 | $112,832 | $37,609 | $75,223 |
Source: Public Records
Map
Nearby Homes
- 413 El Portal Ct
- 310 Buena Vista Ct
- 3315 Line Dr
- 3367 M St
- 309 Silver Star Ct
- 512 Spalding Ct
- 3375 De Anza Ct
- 3514 Oakhurst Ave
- 3482 Arch Rock St
- 749 Junipero Ct
- 3640 Syracuse Ct
- 3576 San Jose Ave
- 3536 Trinity Ct
- 899 La Jolla Way
- 3585 Cabrillo Ct
- 3334 El Capitan Ct
- 3191 El Capitan Ave
- 3584 Gateway Place
- 3150 College Ave
- 866 Purdue Ct
- 435 El Portal Ct
- 467 El Portal Ct
- 456 Buena Vista Dr
- 436 Buena Vista Dr
- 423 El Portal Ct
- 476 Buena Vista Dr
- 485 El Portal Ct
- 454 El Portal Ct
- 424 Buena Vista Dr
- 434 El Portal Ct
- 468 El Portal Ct
- 422 El Portal Ct
- 484 El Portal Ct
- 414 Buena Vista Dr
- 493 El Portal Ct
- 412 El Portal Ct
- 403 El Portal Ct
- 457 Rice Ct
- 437 Rice Ct
- 471 Rice Ct