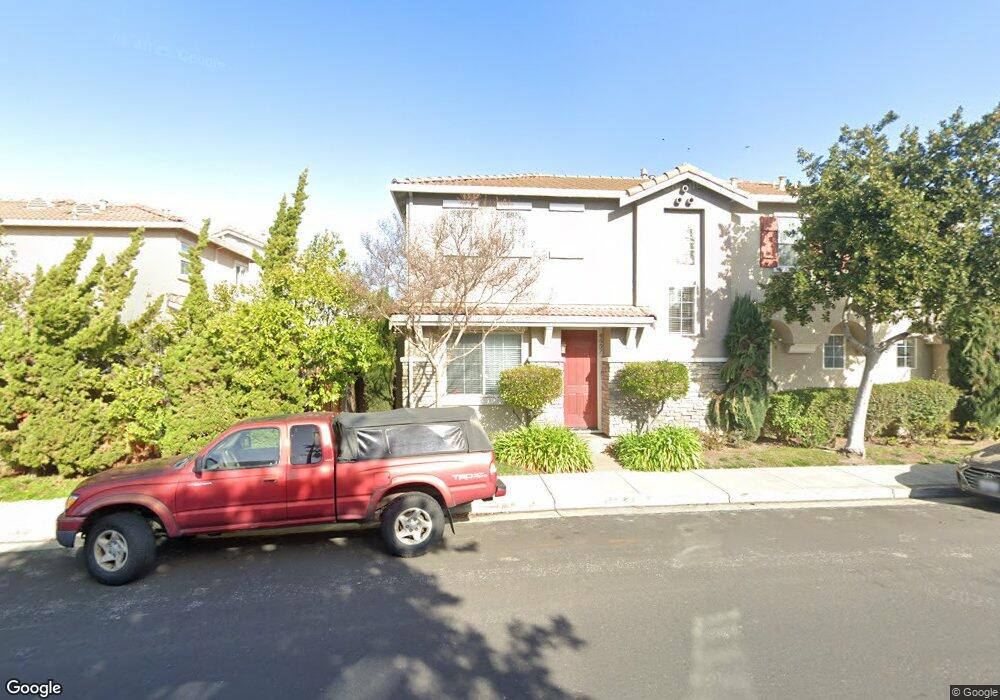
4555 Cheeney St Santa Clara, CA 95054
North Santa Clara NeighborhoodEstimated Value: $1,383,000 - $1,495,000
3
Beds
4
Baths
1,589
Sq Ft
$916/Sq Ft
Est. Value
About This Home
This home is located at 4555 Cheeney St, Santa Clara, CA 95054 and is currently estimated at $1,455,083, approximately $915 per square foot. 4555 Cheeney St is a home located in Santa Clara County with nearby schools including Kathryn Hughes Elementary School, Buchser Middle School, and Santa Clara High School.
Ownership History
Date
Name
Owned For
Owner Type
Purchase Details
Closed on
Jul 14, 2020
Sold by
Lu Yi and Zhang Jianxin
Bought by
Zhang Jlanxin and Lu Yi
Current Estimated Value
Home Financials for this Owner
Home Financials are based on the most recent Mortgage that was taken out on this home.
Original Mortgage
$326,000
Outstanding Balance
$289,075
Interest Rate
3.1%
Mortgage Type
New Conventional
Estimated Equity
$1,166,008
Purchase Details
Closed on
Jul 16, 2012
Sold by
Zhang Jianxin and Lu Yi
Bought by
Zhang Jianxin and Lu Yi
Purchase Details
Closed on
Jan 16, 2009
Sold by
Zhang Jianxin and Lu Yi
Bought by
Zhang Jianxin and Lu Yi
Home Financials for this Owner
Home Financials are based on the most recent Mortgage that was taken out on this home.
Original Mortgage
$417,000
Interest Rate
5.49%
Mortgage Type
New Conventional
Purchase Details
Closed on
Oct 10, 2008
Sold by
Zhang Jianxin and Lu Yi
Bought by
Zhang Jianxin and Lu Yi
Purchase Details
Closed on
Apr 30, 2002
Sold by
First American Title Guaranty Company
Bought by
Zhang Jianxin and Lu Yi
Home Financials for this Owner
Home Financials are based on the most recent Mortgage that was taken out on this home.
Original Mortgage
$407,950
Interest Rate
5.25%
Create a Home Valuation Report for This Property
The Home Valuation Report is an in-depth analysis detailing your home's value as well as a comparison with similar homes in the area
Home Values in the Area
Average Home Value in this Area
Purchase History
| Date | Buyer | Sale Price | Title Company |
|---|---|---|---|
| Zhang Jlanxin | -- | Wfg National Title Ins Co | |
| Lu Yi | -- | Wfg National Title Ins Co | |
| Zhang Jianxin | -- | Old Republic Title Company | |
| Zhang Jianxin | -- | First American Title Lenders | |
| Zhang Jianxin | -- | None Available | |
| Zhang Jianxin | $510,000 | First American Title Guarant |
Source: Public Records
Mortgage History
| Date | Status | Borrower | Loan Amount |
|---|---|---|---|
| Open | Lu Yi | $326,000 | |
| Closed | Zhang Jianxin | $417,000 | |
| Previous Owner | Zhang Jianxin | $407,950 |
Source: Public Records
Tax History Compared to Growth
Tax History
| Year | Tax Paid | Tax Assessment Tax Assessment Total Assessment is a certain percentage of the fair market value that is determined by local assessors to be the total taxable value of land and additions on the property. | Land | Improvement |
|---|---|---|---|---|
| 2025 | $8,554 | $738,561 | $506,910 | $231,651 |
| 2024 | $8,554 | $724,080 | $496,971 | $227,109 |
| 2023 | $8,468 | $709,883 | $487,227 | $222,656 |
| 2022 | $8,327 | $695,965 | $477,674 | $218,291 |
| 2021 | $8,294 | $682,319 | $468,308 | $214,011 |
| 2020 | $8,144 | $675,324 | $463,507 | $211,817 |
| 2019 | $8,134 | $662,083 | $454,419 | $207,664 |
| 2018 | $7,612 | $649,102 | $445,509 | $203,593 |
| 2017 | $7,575 | $636,375 | $436,774 | $199,601 |
| 2016 | $7,429 | $623,898 | $428,210 | $195,688 |
| 2015 | $7,400 | $614,527 | $421,778 | $192,749 |
| 2014 | $7,031 | $602,490 | $413,516 | $188,974 |
Source: Public Records
Map
Nearby Homes
- 4503 Cheeney St
- 4676 Wilcox Ave
- 4699 Snead Dr
- 2313 Villa Place
- 1901 Garzoni Place Unit 405
- 1898 Garzoni Place
- 1883 Agnew Rd Unit 301
- 1883 Agnew Rd Unit 341
- 1883 Agnew Rd Unit 367
- 2200 Agnew Rd Unit 212
- 2200 Agnew Rd Unit 118
- 4216 Atlantic Ct
- 1752 Beech St
- 1900 Chestnut St
- 4464 Laird Cir
- 930 Clyde Ave
- 920 Clyde Ave
- 4012 Fitzpatrick Way Unit 3
- 783 Laurie Ave
- 3901 Lick Mill Blvd Unit 358
- 4553 Cheeney St
- 2186 Esperanca Ave
- 2184 Esperanca Ave
- 4557 Cheeney St
- 4551 Cheeney St
- 2188 Esperanca Ave
- 2161 Kingsbury Cir
- 2163 Kingsbury Cir
- 2182 Esperanca Ave
- 4549 Cheeney St
- 4547 Cheeney St
- 2172 Esperanca Ave
- 2190 Esperanca Ave
- 2180 Esperanca Ave
- 2165 Kingsbury Cir
- 2170 Esperanca Ave
- 2159 Kingsbury Cir
- 4560 Cheeney St
- 2192 Esperanca Ave
- 2174 Esperanca Ave