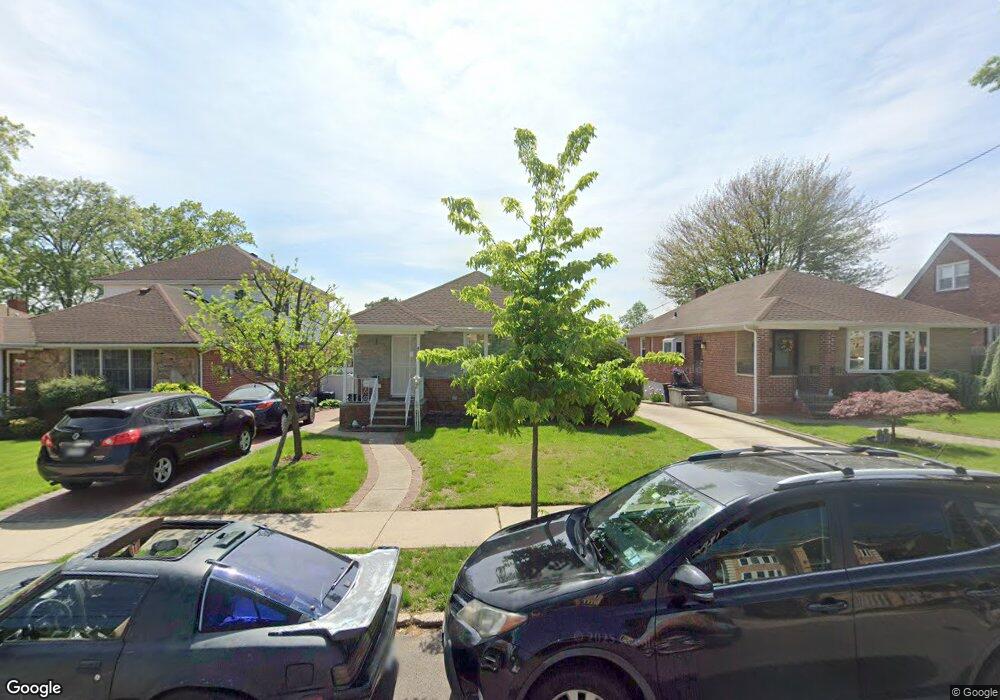
4564 Zion St Little Neck, NY 11362
Douglaston NeighborhoodEstimated Value: $1,124,000 - $1,187,000
--
Bed
--
Bath
1,196
Sq Ft
$975/Sq Ft
Est. Value
About This Home
This home is located at 4564 Zion St, Little Neck, NY 11362 and is currently estimated at $1,166,331, approximately $975 per square foot. 4564 Zion St is a home located in Queens County with nearby schools including P.S. 94 - David D. Porter, Louis Pasteur Middle School 67, and Benjamin N Cardozo High School.
Ownership History
Date
Name
Owned For
Owner Type
Purchase Details
Closed on
Jun 9, 2023
Sold by
Zhang Kexian
Bought by
Cheng Wei Qing and Shi Lucy Rui
Current Estimated Value
Home Financials for this Owner
Home Financials are based on the most recent Mortgage that was taken out on this home.
Original Mortgage
$902,400
Outstanding Balance
$877,124
Interest Rate
6.35%
Mortgage Type
Purchase Money Mortgage
Estimated Equity
$289,207
Purchase Details
Closed on
Nov 9, 2012
Sold by
Claudia Almoslino As Trustee and Nancy Davneiro As Trustee
Bought by
Zhang Kexian
Home Financials for this Owner
Home Financials are based on the most recent Mortgage that was taken out on this home.
Original Mortgage
$340,000
Interest Rate
3.42%
Mortgage Type
New Conventional
Purchase Details
Closed on
Jul 8, 2003
Sold by
Almoslino Mauricette
Bought by
Almoslino Claudia and Davneiro Nancy
Create a Home Valuation Report for This Property
The Home Valuation Report is an in-depth analysis detailing your home's value as well as a comparison with similar homes in the area
Home Values in the Area
Average Home Value in this Area
Purchase History
| Date | Buyer | Sale Price | Title Company |
|---|---|---|---|
| Cheng Wei Qing | $1,128,000 | -- | |
| Cheng Wei Qing | $1,128,000 | -- | |
| Zhang Kexian | $680,000 | -- | |
| Zhang Kexian | $680,000 | -- | |
| Almoslino Claudia | -- | -- | |
| Almoslino Claudia | -- | -- |
Source: Public Records
Mortgage History
| Date | Status | Borrower | Loan Amount |
|---|---|---|---|
| Open | Cheng Wei Qing | $902,400 | |
| Closed | Cheng Wei Qing | $902,400 | |
| Previous Owner | Zhang Kexian | $340,000 |
Source: Public Records
Tax History Compared to Growth
Tax History
| Year | Tax Paid | Tax Assessment Tax Assessment Total Assessment is a certain percentage of the fair market value that is determined by local assessors to be the total taxable value of land and additions on the property. | Land | Improvement |
|---|---|---|---|---|
| 2025 | $10,555 | $52,790 | $11,970 | $40,820 |
| 2024 | $10,555 | $52,550 | $13,439 | $39,111 |
| 2023 | $9,996 | $49,766 | $13,067 | $36,699 |
| 2022 | $9,867 | $57,420 | $15,360 | $42,060 |
| 2021 | $9,814 | $58,740 | $15,360 | $43,380 |
| 2020 | $9,312 | $55,020 | $15,360 | $39,660 |
| 2019 | $9,161 | $55,380 | $15,360 | $40,020 |
| 2018 | $8,454 | $41,472 | $13,933 | $27,539 |
| 2017 | $8,397 | $41,190 | $14,405 | $26,785 |
| 2016 | $7,768 | $41,190 | $14,405 | $26,785 |
| 2015 | $1,750 | $36,660 | $17,040 | $19,620 |
| 2014 | $1,750 | $36,494 | $14,536 | $21,958 |
Source: Public Records
Map
Nearby Homes
- 45-26 Zion St
- 4521 248th St
- 24854 Thebes Ave
- 248-14 Deepdale Ave
- 4529 Marathon Pkwy
- 5006 Marathon Pkwy
- 24947 Rushmore Terrace
- 50-54 Deepdale Place
- 4330 248th St
- 249-14 Cambria Ave
- 50-43 Morenci Ln
- 43-17 248th St
- 44-31 244th St
- 249-35 51st Ave
- 5022 Overbrook St
- 50-15 245th St
- 51-27 Browvale Ln
- 252-25 Leith Rd
- 242-16 Pine St
- 241-20 Northern Blvd Unit 6E