

4569 The Strand Baltimore, MD 21215
Edgecomb Neighborhood
3
Beds
1.5
Baths
1,152
Sq Ft
1,728
Sq Ft Lot
Highlights
- Traditional Architecture
- Cedar Closet
- Central Heating and Cooling System
- No HOA
- Recessed Lighting
- Ceiling Fan
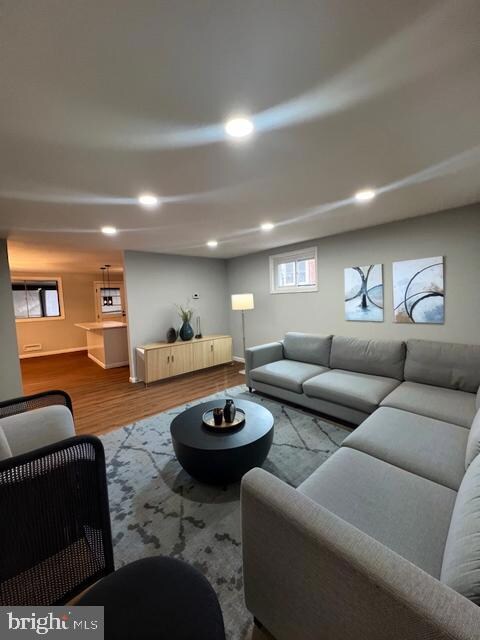
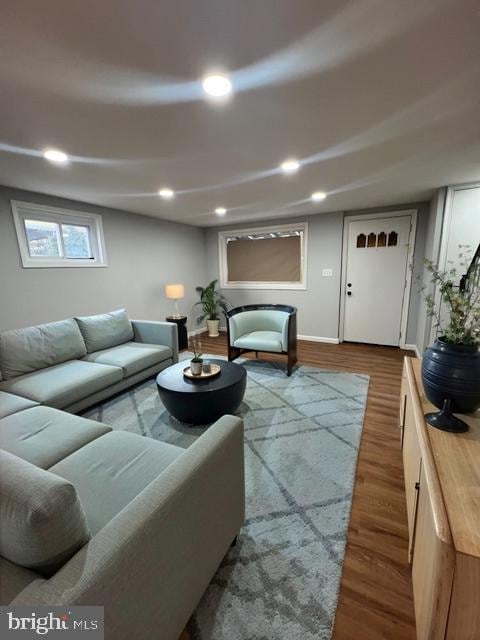
About This Home
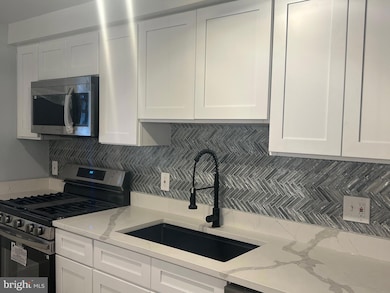
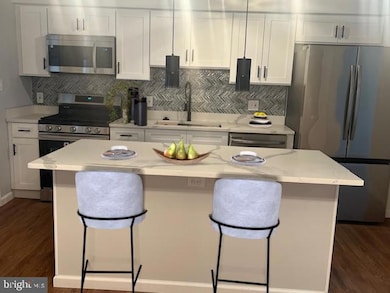
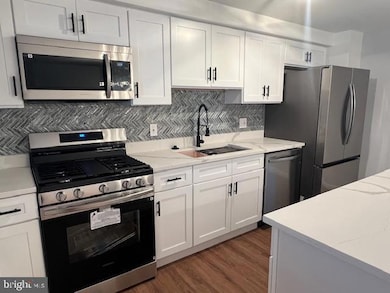
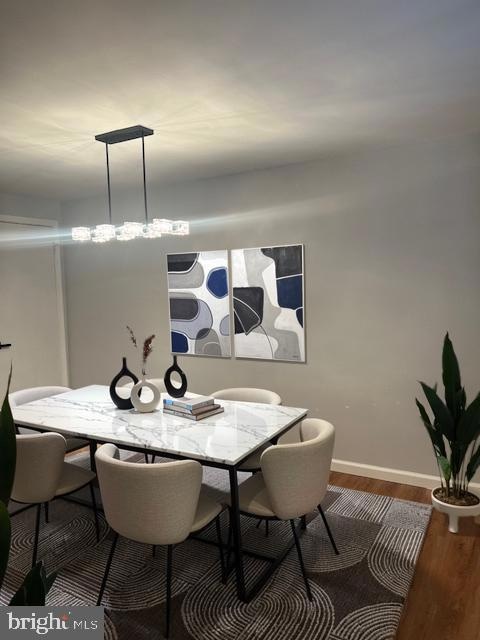
As of July 2025PRiCE REDUCTION!!!!!This Lovely Renovated Gem is completely Move-in Ready in Cylburn !!! Great location 5.8 miles to Downtown, 1.1 miles to Sinai Hospital and 0.5 Cylburn Arboretum. This semi-detached 3 Bedroom, 1 Full Bath and 1 Half Bath Features include: New Kitchen with Stainless Steel Appliances, Beautiful Quartz Countertops, Recess Lighting, Contemporary light fixtures, New LVP Floors, New Carpet, Open Floor Plan, Rear sunporch, Cedar closet, and Dryer/Washer machine in "as-is" condition. Parking pad in rear. HSA Home warranty included per Agent remarks. Pictures are virtually staged. Property may qualify for the Buy Back the Block grant program.
Last Agent to Sell the Property
Berkshire Hathaway HomeServices Homesale Realty License #5018475 Listed on: 02/14/2025
Townhouse Details
Home Type
- Townhome
Est. Annual Taxes
- $2,877
Year Built
- Built in 1961
Parking
- On-Street Parking
Home Design
- Semi-Detached or Twin Home
- Traditional Architecture
- Flat Roof Shape
- Brick Exterior Construction
- Brick Foundation
Interior Spaces
- Property has 2 Levels
- Ceiling Fan
- Recessed Lighting
- Dining Area
- Finished Basement
- Laundry in Basement
Kitchen
- Gas Oven or Range
- Microwave
- Dishwasher
Bedrooms and Bathrooms
- 3 Bedrooms
- Cedar Closet
Utilities
- Central Heating and Cooling System
- Cooling System Utilizes Natural Gas
- Natural Gas Water Heater
Additional Features
- Storage Shed
- 1,728 Sq Ft Lot
Community Details
- No Home Owners Association
- Clyburn Subdivision
Listing and Financial Details
- Tax Lot 044
- Assessor Parcel Number 0327184811 044
Ownership History
Date
Name
Owned For
Owner Type
Purchase Details
Listed on
Sep 27, 2024
Closed on
Oct 25, 2024
Sold by
Davenport Charles Calvert and Mosley Charlene R
Bought by
Laws Properties Llc
Seller's Agent
Bob Lucido
Keller Williams Lucido Agency
Buyer's Agent
NIKITA LAWS
Berkshire Hathaway HomeServices Homesale Realty
List Price
$150,000
Sold Price
$130,000
Premium/Discount to List
-$20,000
-13.33%
Total Days on Market
114
Views
59
Home Financials for this Owner
Home Financials are based on the most recent Mortgage that was taken out on this home.
Avg. Annual Appreciation
133.92%
Original Mortgage
$164,200
Interest Rate
6.72%
Mortgage Type
New Conventional
Similar Homes in Baltimore, MD
Create a Home Valuation Report for This Property
The Home Valuation Report is an in-depth analysis detailing your home's value as well as a comparison with similar homes in the area
Home Values in the Area
Average Home Value in this Area
Purchase History
| Date | Type | Sale Price | Title Company |
|---|---|---|---|
| Deed | $130,000 | Title Resources Guaranty | |
| Deed | $130,000 | Title Resources Guaranty |
Source: Public Records
Mortgage History
| Date | Status | Loan Amount | Loan Type |
|---|---|---|---|
| Previous Owner | $164,200 | New Conventional | |
| Previous Owner | $34,000 | Stand Alone Second | |
| Previous Owner | $13,500 | Stand Alone Second |
Source: Public Records
Property History
| Date | Event | Price | Change | Sq Ft Price |
|---|---|---|---|---|
| 07/18/2025 07/18/25 | Sold | $225,000 | -2.2% | $195 / Sq Ft |
| 07/16/2025 07/16/25 | Price Changed | $229,990 | 0.0% | $200 / Sq Ft |
| 06/09/2025 06/09/25 | Pending | -- | -- | -- |
| 05/30/2025 05/30/25 | Price Changed | $229,990 | -2.1% | $200 / Sq Ft |
| 05/08/2025 05/08/25 | For Sale | $234,900 | 0.0% | $204 / Sq Ft |
| 05/05/2025 05/05/25 | Off Market | $234,900 | -- | -- |
| 04/29/2025 04/29/25 | Price Changed | $234,900 | 0.0% | $204 / Sq Ft |
| 04/20/2025 04/20/25 | Price Changed | $234,990 | -2.1% | $204 / Sq Ft |
| 03/31/2025 03/31/25 | Price Changed | $239,990 | -2.0% | $208 / Sq Ft |
| 03/24/2025 03/24/25 | Price Changed | $245,000 | -1.0% | $213 / Sq Ft |
| 03/12/2025 03/12/25 | Price Changed | $247,500 | -1.0% | $215 / Sq Ft |
| 02/14/2025 02/14/25 | For Sale | $250,000 | +92.3% | $217 / Sq Ft |
| 10/25/2024 10/25/24 | Sold | $130,000 | -13.3% | $113 / Sq Ft |
| 10/07/2024 10/07/24 | Pending | -- | -- | -- |
| 09/27/2024 09/27/24 | For Sale | $150,000 | -- | $130 / Sq Ft |
Source: Bright MLS
Tax History Compared to Growth
Tax History
| Year | Tax Paid | Tax Assessment Tax Assessment Total Assessment is a certain percentage of the fair market value that is determined by local assessors to be the total taxable value of land and additions on the property. | Land | Improvement |
|---|---|---|---|---|
| 2025 | $2,582 | $129,833 | -- | -- |
| 2024 | $2,582 | $121,900 | $20,000 | $101,900 |
| 2023 | $2,738 | $117,000 | $0 | $0 |
| 2022 | $2,646 | $112,100 | $0 | $0 |
| 2021 | $2,530 | $107,200 | $20,000 | $87,200 |
| 2020 | $2,233 | $105,067 | $0 | $0 |
| 2019 | $2,171 | $102,933 | $0 | $0 |
| 2018 | $2,177 | $100,800 | $20,000 | $80,800 |
| 2017 | $2,054 | $94,500 | $0 | $0 |
| 2016 | $1,961 | $88,200 | $0 | $0 |
| 2015 | $1,961 | $81,900 | $0 | $0 |
| 2014 | $1,961 | $81,900 | $0 | $0 |
Source: Public Records
Agents Affiliated with this Home
-
NIKITA LAWS
N
Seller's Agent in 2025
NIKITA LAWS
Berkshire Hathaway HomeServices Homesale Realty
(410) 415-3058
3 in this area
7 Total Sales
-
Debbie Reynolds
Seller Co-Listing Agent in 2025
Debbie Reynolds
Berkshire Hathaway HomeServices Homesale Realty
(410) 365-9625
2 in this area
107 Total Sales
-
Taisha Hammond
Buyer's Agent in 2025
Taisha Hammond
Corner House Realty
(443) 787-8585
11 Total Sales
-
Bob Lucido
Seller's Agent in 2024
Bob Lucido
Keller Williams Lucido Agency
(410) 979-6024
2 in this area
3,085 Total Sales
-
Stacey Allen
Seller Co-Listing Agent in 2024
Stacey Allen
Keller Williams Lucido Agency
(615) 403-4707
1 in this area
127 Total Sales
Map
Source: Bright MLS
MLS Number: MDBA2155484
APN: 4811-044
Disclaimer: Certain information contained herein is derived from information provided by parties other than Homes.com. All information provided is deemed reliable, but is not guaranteed to be accurate and should be independently verified.
![]() The data relating to real estate for sale on this website appears in part through the BRIGHT Internet Data Exchange program, a voluntary cooperative exchange of property listing data between licensed real estate brokerage firms, and is provided by BRIGHT through a licensing agreement.
The data relating to real estate for sale on this website appears in part through the BRIGHT Internet Data Exchange program, a voluntary cooperative exchange of property listing data between licensed real estate brokerage firms, and is provided by BRIGHT through a licensing agreement.
Listing information is from various brokers who participate in the Bright MLS IDX program and not all listings may be visible on the site.
The property information being provided on or through the website is for the personal, non-commercial use of consumers and such information may not be used for any purpose other than to identify prospective properties consumers may be interested in purchasing.
Some properties which appear for sale on the website may no longer be available because they are for instance, under contract, sold or are no longer being offered for sale.
Property information displayed is deemed reliable but is not guaranteed.
Copyright 2025 Bright MLS, Inc.
Nearby Homes
- 4558 Finney Ave
- 4530 Finney Ave
- 4575 Derby Manor Dr
- 4577 Derby Manor Dr
- 2834 Edgecombe Cir S
- 2834 Virginia Ave
- 2814 Oakford Ave
- 2443 W Cold Spring Ln
- 3002 Wylie Ave
- 4223 Roland View Ave
- 3021 Oakford Ave
- 4818 Lanier Ave
- 4207 Roland View Ave
- 2604 Park Heights Terrace
- 2544 Boarman Ave
- 2903 Woodland Ave
- 2627 Loyola Northway
- 2610 Park Heights Terrace
- 2527 Oakley Ave
- 3119 Oakford Ave