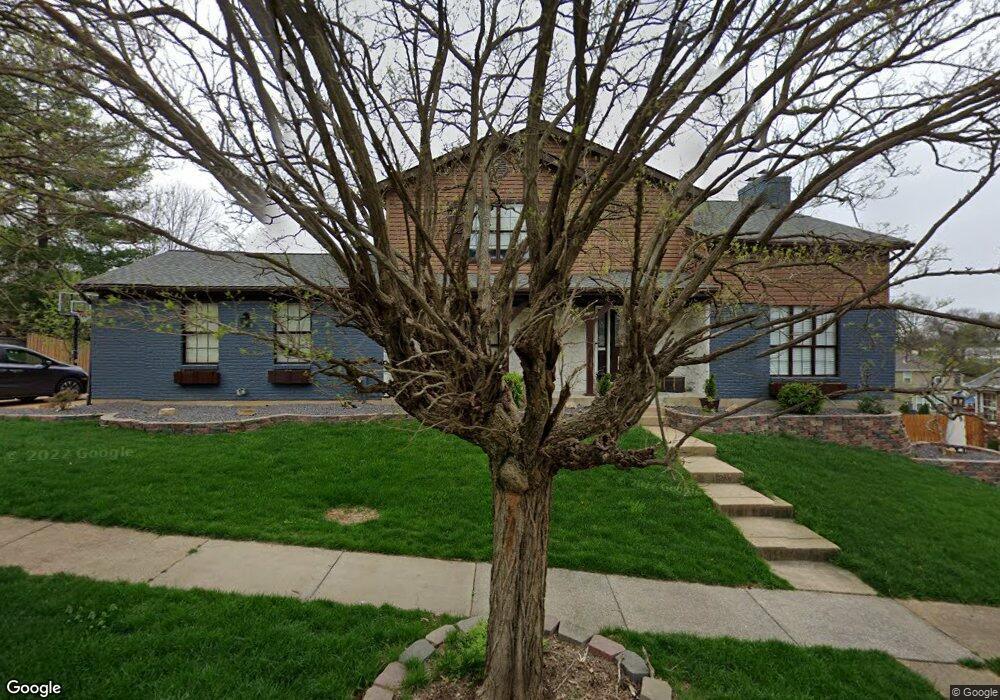
4569 Woodworth Ln Saint Louis, MO 63128
Estimated Value: $448,000 - $496,501
4
Beds
3
Baths
2,641
Sq Ft
$182/Sq Ft
Est. Value
About This Home
This home is located at 4569 Woodworth Ln, Saint Louis, MO 63128 and is currently estimated at $480,625, approximately $181 per square foot. 4569 Woodworth Ln is a home located in St. Louis County with nearby schools including Kennerly Elementary School, Sperreng Middle School, and Lindbergh High School.
Ownership History
Date
Name
Owned For
Owner Type
Purchase Details
Closed on
Apr 24, 2013
Sold by
Federal Home Loan Mortgage Corporation
Bought by
Meeker Jacob D and Meeker Alison J
Current Estimated Value
Home Financials for this Owner
Home Financials are based on the most recent Mortgage that was taken out on this home.
Original Mortgage
$235,554
Outstanding Balance
$164,602
Interest Rate
3.25%
Mortgage Type
FHA
Estimated Equity
$316,023
Purchase Details
Closed on
Sep 25, 2012
Sold by
Citimortgage Inc
Bought by
Federal Home Loan Mortgage Corporation
Purchase Details
Closed on
Aug 13, 2012
Sold by
Timmons Robert R and Timmons Pamela M
Bought by
Citimortgage Inc
Purchase Details
Closed on
Oct 29, 2002
Sold by
Timmons Robert R and Timmons Pamela M
Bought by
Timmons Robert R and Timmons Pamela M
Home Financials for this Owner
Home Financials are based on the most recent Mortgage that was taken out on this home.
Original Mortgage
$232,000
Interest Rate
5.95%
Create a Home Valuation Report for This Property
The Home Valuation Report is an in-depth analysis detailing your home's value as well as a comparison with similar homes in the area
Home Values in the Area
Average Home Value in this Area
Purchase History
| Date | Buyer | Sale Price | Title Company |
|---|---|---|---|
| Meeker Jacob D | $235,554 | Security Title Insurance Age | |
| Federal Home Loan Mortgage Corporation | -- | None Available | |
| Citimortgage Inc | $218,000 | None Available | |
| Timmons Robert R | -- | -- |
Source: Public Records
Mortgage History
| Date | Status | Borrower | Loan Amount |
|---|---|---|---|
| Open | Meeker Jacob D | $235,554 | |
| Previous Owner | Timmons Robert R | $232,000 |
Source: Public Records
Tax History Compared to Growth
Tax History
| Year | Tax Paid | Tax Assessment Tax Assessment Total Assessment is a certain percentage of the fair market value that is determined by local assessors to be the total taxable value of land and additions on the property. | Land | Improvement |
|---|---|---|---|---|
| 2025 | $4,813 | $78,450 | $17,730 | $60,720 |
| 2024 | $4,813 | $74,080 | $19,680 | $54,400 |
| 2023 | $4,801 | $74,080 | $19,680 | $54,400 |
| 2022 | $4,382 | $64,860 | $19,680 | $45,180 |
| 2021 | $4,226 | $64,860 | $19,680 | $45,180 |
| 2020 | $4,025 | $59,580 | $17,440 | $42,140 |
| 2019 | $4,015 | $59,580 | $17,440 | $42,140 |
| 2018 | $3,732 | $50,350 | $10,720 | $39,630 |
| 2017 | $3,691 | $50,350 | $10,720 | $39,630 |
| 2016 | $3,375 | $43,680 | $9,710 | $33,970 |
| 2015 | $3,323 | $43,680 | $9,710 | $33,970 |
| 2014 | $3,437 | $44,750 | $5,040 | $39,710 |
Source: Public Records
Map
Nearby Homes
- 4645 Tauneybrook Dr
- 4801 Langtree Dr
- 12055 Charwick Dr
- 4643 Littlebury Dr
- 5100 Melitta Dr
- 10033 Carolynne Dr
- 4818 Chapel Hill Dr
- 5135 Towne Centre Dr
- 12015 Charwick Dr
- 10124 Carolynne Dr
- 4839 Hursley Dr
- 4931 Theiss Rd
- 4833 Hursley Dr
- 4449 Pinyon Jay Ct
- 4829 Vermilion Dr
- 4838 Dorsie Dr
- 11862 E Concord Rd
- 4942 Caribee Dr
- 10070 Sakura Dr Unit 100070
- 10080 Sakura Dr Unit 1
- 4563 Woodworth Ln
- 4616 Langtree Dr
- 4612 Langtree Dr
- 4620 Langtree Dr
- 4570 Woodworth Ln
- 4564 Woodworth Ln
- 4608 Langtree Dr
- 4557 Woodworth Ln
- 4576 Woodworth Ln
- 4558 Woodworth Ln
- 4670 Langtree Dr
- 4604 Langtree Dr
- 4582 Woodworth Ln
- 4657 Langtree Dr
- 4615 Bridlewood Terrace
- 4551 Woodworth Ln
- 4623 Bridlewood Terrace
- 4629 Bridlewood Terrace
- 4603 Bridlewood Terrace
- 4550 Woodworth Ln