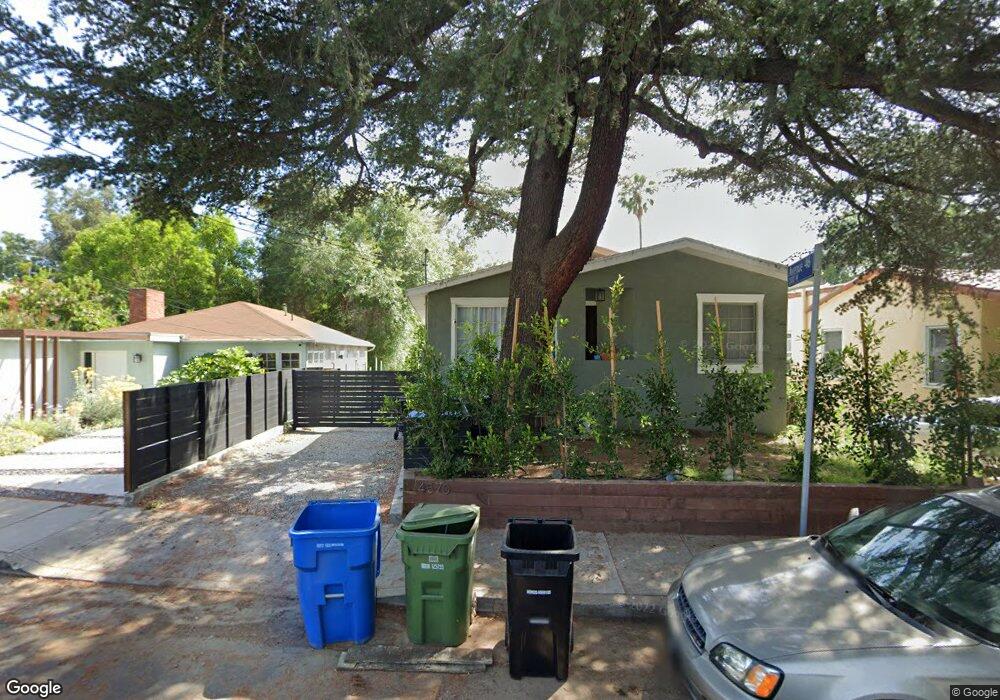
4570 Mont Eagle Place Los Angeles, CA 90041
Eagle Rock NeighborhoodEstimated Value: $1,045,324 - $1,166,000
2
Beds
1
Bath
912
Sq Ft
$1,207/Sq Ft
Est. Value
About This Home
This home is located at 4570 Mont Eagle Place, Los Angeles, CA 90041 and is currently estimated at $1,100,331, approximately $1,206 per square foot. 4570 Mont Eagle Place is a home located in Los Angeles County with nearby schools including Toland Way Elementary School, Benjamin Franklin High School, and Eagle Rock High School.
Ownership History
Date
Name
Owned For
Owner Type
Purchase Details
Closed on
Nov 13, 2015
Sold by
Mertz Joshua and Mertz Linda Tandy
Bought by
Kisvarday Jason
Current Estimated Value
Home Financials for this Owner
Home Financials are based on the most recent Mortgage that was taken out on this home.
Original Mortgage
$440,000
Interest Rate
3.92%
Mortgage Type
New Conventional
Purchase Details
Closed on
Nov 10, 1999
Sold by
Mertz Joshua and Mertz Linda Tandy
Bought by
Mertz Joshua and Mertz Linda Tandy
Home Financials for this Owner
Home Financials are based on the most recent Mortgage that was taken out on this home.
Original Mortgage
$50,000
Interest Rate
7.82%
Purchase Details
Closed on
Aug 10, 1998
Sold by
Omullen James J
Bought by
Mertz Joshua and Tandy Linda Lea
Home Financials for this Owner
Home Financials are based on the most recent Mortgage that was taken out on this home.
Original Mortgage
$138,600
Interest Rate
6.88%
Mortgage Type
FHA
Create a Home Valuation Report for This Property
The Home Valuation Report is an in-depth analysis detailing your home's value as well as a comparison with similar homes in the area
Home Values in the Area
Average Home Value in this Area
Purchase History
| Date | Buyer | Sale Price | Title Company |
|---|---|---|---|
| Kisvarday Jason | $550,000 | Wfg Title Company | |
| Mertz Joshua | -- | Benefit Land Title Company | |
| Mertz Joshua | $88,000 | Commonwealth Title |
Source: Public Records
Mortgage History
| Date | Status | Borrower | Loan Amount |
|---|---|---|---|
| Previous Owner | Kisvarday Jason | $440,000 | |
| Previous Owner | Mertz Joshua | $50,000 | |
| Previous Owner | Mertz Joshua | $138,600 |
Source: Public Records
Tax History Compared to Growth
Tax History
| Year | Tax Paid | Tax Assessment Tax Assessment Total Assessment is a certain percentage of the fair market value that is determined by local assessors to be the total taxable value of land and additions on the property. | Land | Improvement |
|---|---|---|---|---|
| 2025 | $7,867 | $651,082 | $520,868 | $130,214 |
| 2024 | $7,867 | $638,316 | $510,655 | $127,661 |
| 2023 | $7,715 | $625,801 | $500,643 | $125,158 |
| 2022 | $7,354 | $613,531 | $490,827 | $122,704 |
| 2021 | $7,266 | $601,502 | $481,203 | $120,299 |
| 2020 | $7,339 | $595,335 | $476,269 | $119,066 |
| 2019 | $7,048 | $583,663 | $466,931 | $116,732 |
| 2018 | $6,999 | $572,220 | $457,776 | $114,444 |
| 2016 | $2,387 | $188,797 | $121,828 | $66,969 |
| 2015 | $2,354 | $185,963 | $119,999 | $65,964 |
| 2014 | $2,371 | $182,321 | $117,649 | $64,672 |
Source: Public Records
Map
Nearby Homes
- 4824 Toland Way
- 4500 Mont Eagle Place
- 4654 Toland Way
- 4312 Division St
- 4780 Hub St
- 1336 Armadale Ave
- 1087 Oneonta Dr
- 1070 N Oban Dr
- 4263 Barryknoll Dr
- 1046 Oban Dr
- 4666 York Blvd
- 925 927 El Paso Dr
- 4854 Buchanan St
- 1038 Oban Dr
- 4623 Jessica Dr
- 981 Nordica Dr
- 1017 Dexter St
- 4925 Buchanan St
- 1048 Dexter St
- 1113 N Avenue 50
- 4562 Mont Eagle Place
- 4560 Mont Eagle Place
- 4572 Mont Eagle Place
- 4606 Mont Eagle Place
- 4558 Mont Eagle Place
- 4567 Mont Eagle Place
- 4552 Mont Eagle Place
- 4610 Mont Eagle Place
- 4563 Mont Eagle Place
- 4550 Mont Eagle Place
- 1317 N Avenue 46
- 1302 N Avenue 46
- 4605 Mont Eagle Place
- 4542 Mont Eagle Place
- 4557 Mont Eagle Place
- 4611 Mont Eagle Place
- 4616 Mont Eagle Place
- 1323 N Avenue 46
- 4549 Mont Eagle Place
- 1308 N Avenue 46