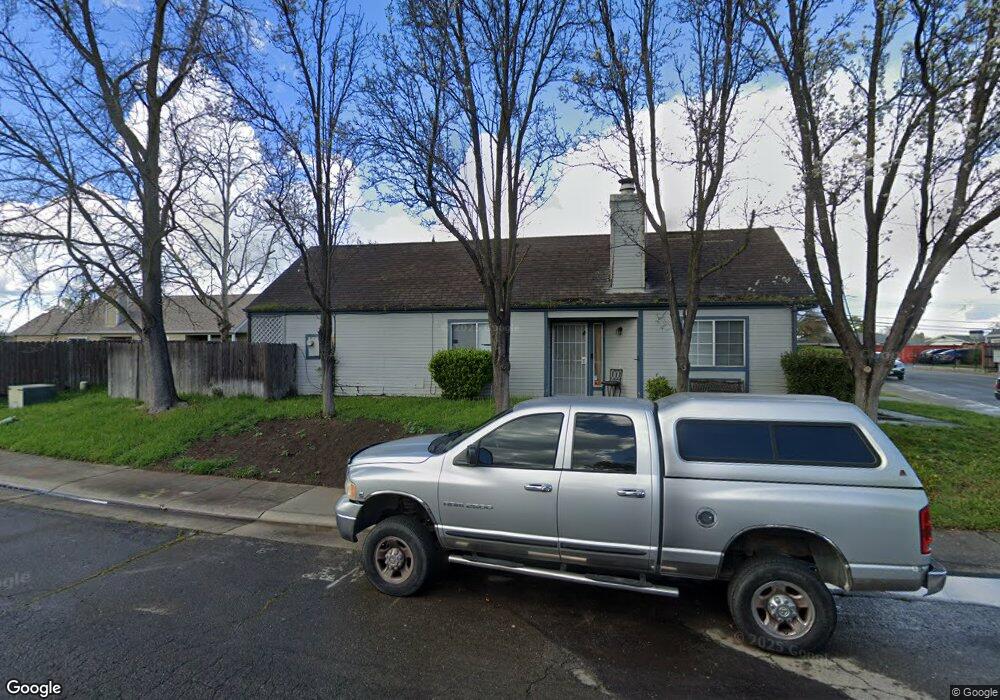
4571 Underwood Way Sacramento, CA 95823
Estimated Value: $77,000 - $403,000
3
Beds
2
Baths
1,040
Sq Ft
$287/Sq Ft
Est. Value
About This Home
This home is located at 4571 Underwood Way, Sacramento, CA 95823 and is currently estimated at $298,069, approximately $286 per square foot. 4571 Underwood Way is a home located in Sacramento County with nearby schools including Clayton B. Wire Elementary School, Fern Bacon Middle School, and Hiram W. Johnson High School.
Ownership History
Date
Name
Owned For
Owner Type
Purchase Details
Closed on
Jul 5, 2011
Sold by
29Th Street Single Family Fund Lp
Bought by
Yu Sophia and Yu Sandy
Current Estimated Value
Purchase Details
Closed on
Nov 3, 2010
Sold by
Blue Jeffrey G
Bought by
29Th Street Single Family Fund V Lp
Purchase Details
Closed on
Nov 19, 2004
Sold by
Blue Jeffrey and Nguyen Christina
Bought by
Peak Capital Llc
Purchase Details
Closed on
Feb 24, 2004
Sold by
Stumpf Raymond V and Gary Frank Stumpf Revocable Tr
Bought by
Blue Jeffrey G
Home Financials for this Owner
Home Financials are based on the most recent Mortgage that was taken out on this home.
Original Mortgage
$169,200
Interest Rate
5.62%
Mortgage Type
Purchase Money Mortgage
Purchase Details
Closed on
Jul 20, 1995
Sold by
Stumpf Gary F and Stumpf Gary Frank
Bought by
Stumpf Raymond V and The Gary Frank Stumpf Revocabl
Create a Home Valuation Report for This Property
The Home Valuation Report is an in-depth analysis detailing your home's value as well as a comparison with similar homes in the area
Home Values in the Area
Average Home Value in this Area
Purchase History
| Date | Buyer | Sale Price | Title Company |
|---|---|---|---|
| Yu Sophia | $70,000 | Stewart Title Of Sacramento | |
| 29Th Street Single Family Fund V Lp | $68,057 | None Available | |
| Peak Capital Llc | -- | -- | |
| Blue Jeffrey G | $188,000 | Alliance Title Company | |
| Stumpf Raymond V | -- | -- |
Source: Public Records
Mortgage History
| Date | Status | Borrower | Loan Amount |
|---|---|---|---|
| Previous Owner | Blue Jeffrey G | $169,200 |
Source: Public Records
Tax History Compared to Growth
Tax History
| Year | Tax Paid | Tax Assessment Tax Assessment Total Assessment is a certain percentage of the fair market value that is determined by local assessors to be the total taxable value of land and additions on the property. | Land | Improvement |
|---|---|---|---|---|
| 2025 | $1,135 | $87,913 | $18,837 | $69,076 |
| 2024 | $1,135 | $86,190 | $18,468 | $67,722 |
| 2023 | $1,103 | $84,501 | $18,106 | $66,395 |
| 2022 | $1,100 | $82,845 | $17,751 | $65,094 |
| 2021 | $1,045 | $81,221 | $17,403 | $63,818 |
| 2020 | $1,050 | $80,389 | $17,225 | $63,164 |
| 2019 | $1,028 | $78,814 | $16,888 | $61,926 |
| 2018 | $1,004 | $77,269 | $16,557 | $60,712 |
| 2017 | $987 | $75,755 | $16,233 | $59,522 |
| 2016 | $951 | $74,270 | $15,915 | $58,355 |
| 2015 | $933 | $73,155 | $15,676 | $57,479 |
| 2014 | $916 | $71,723 | $15,369 | $56,354 |
Source: Public Records
Map
Nearby Homes
- 6814 Chevy Chase Way
- 6811 Bowling Dr
- 4304 Greenwich Cir
- 6629 Doreen Way
- 4210 Turnbridge Dr
- 4165 Cuny Ave
- 5201 Sky Pkwy
- 4320 46th Ave
- 6236 Welty Way
- 6244 Donnelly Ln
- 4721 A Pkwy
- 6229 43rd St
- 7304 East Pkwy
- 3635 51st Ave
- 5607 Manmar Way
- 5616 53rd Ave
- 6623 Prentiss Dr
- 6200 43rd St
- 7270 Meadowgate Dr
- 3835 Stillman Park Cir
- 4577 Underwood Way
- 6993 Maynard Way
- 4585 Underwood Way
- 6996 Maynard Way
- 6994 Maynard Way
- 7020 Peevey Ct
- 6991 Maynard Way
- 4570 Underwood Way
- 7022 Peevey Ct
- 6989 Maynard Way
- 4576 Underwood Way
- 7024 Peevey Ct
- 4608 Le Donne Dr
- 6987 Maynard Way
- 4584 Underwood Way
- 7027 Peevey Ct
- 7026 Peevey Ct
- 4600 Le Donne Dr
- 7028 Peevey Ct
- 4614 Le Donne Dr