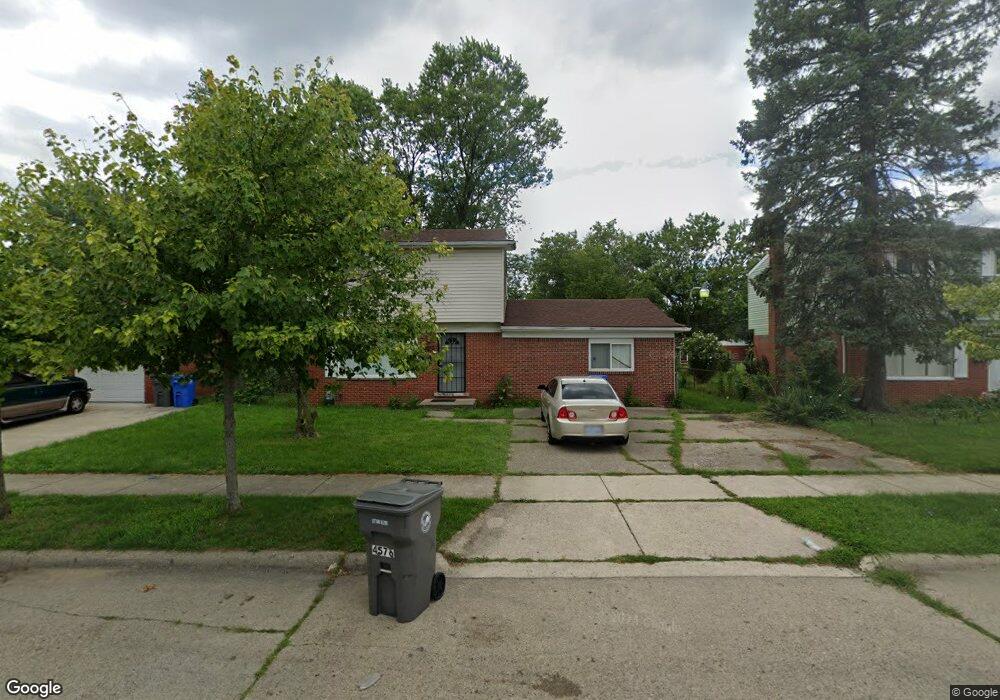
4576 Burton St Inkster, MI 48141
Estimated Value: $113,000 - $171,000
4
Beds
2
Baths
1,300
Sq Ft
$116/Sq Ft
Est. Value
About This Home
This home is located at 4576 Burton St, Inkster, MI 48141 and is currently estimated at $150,686, approximately $115 per square foot. 4576 Burton St is a home located in Wayne County with nearby schools including Romulus Elementary School, Romulus Middle School, and Romulus Senior High School.
Ownership History
Date
Name
Owned For
Owner Type
Purchase Details
Closed on
Nov 18, 2011
Sold by
Wojtowicz Raymond J
Bought by
Gaddis Antonio
Current Estimated Value
Purchase Details
Closed on
Mar 30, 2010
Sold by
Thor Real Estate Llc
Bought by
A G Brothers Against Guns B
Purchase Details
Closed on
Sep 10, 2009
Sold by
Blue Spruce Entities Llc
Bought by
Thor Real Estate Llc
Purchase Details
Closed on
Oct 3, 2007
Sold by
Bronaugh James E and Bronaugh Demetria L
Bought by
Option One Mortgage Corp
Purchase Details
Closed on
Jan 7, 2005
Sold by
Bronaugh Robert L and Bronaugh Demetria L
Bought by
Bronaugh James E
Home Financials for this Owner
Home Financials are based on the most recent Mortgage that was taken out on this home.
Original Mortgage
$113,250
Interest Rate
6.8%
Mortgage Type
New Conventional
Purchase Details
Closed on
Sep 19, 1995
Sold by
Demetria L and Demetria Robert L
Bought by
Demetria L and Bronaugh Robert L
Create a Home Valuation Report for This Property
The Home Valuation Report is an in-depth analysis detailing your home's value as well as a comparison with similar homes in the area
Home Values in the Area
Average Home Value in this Area
Purchase History
| Date | Buyer | Sale Price | Title Company |
|---|---|---|---|
| Gaddis Antonio | $1,000 | None Available | |
| A G Brothers Against Guns B | -- | None Available | |
| Thor Real Estate Llc | -- | None Available | |
| Blue Spruce Entities Llc | -- | None Available | |
| Option One Mortgage Corp | $89,250 | None Available | |
| Bronaugh James E | -- | Transcontinental Title Co | |
| Demetria L | $38,000 | -- |
Source: Public Records
Mortgage History
| Date | Status | Borrower | Loan Amount |
|---|---|---|---|
| Previous Owner | Bronaugh James E | $113,250 |
Source: Public Records
Tax History Compared to Growth
Tax History
| Year | Tax Paid | Tax Assessment Tax Assessment Total Assessment is a certain percentage of the fair market value that is determined by local assessors to be the total taxable value of land and additions on the property. | Land | Improvement |
|---|---|---|---|---|
| 2025 | $1,816 | $70,700 | $0 | $0 |
| 2024 | $1,816 | $52,300 | $0 | $0 |
| 2023 | $2,647 | $41,500 | $0 | $0 |
| 2022 | $2,451 | $34,100 | $0 | $0 |
| 2021 | $3,004 | $30,400 | $0 | $0 |
| 2020 | $2,372 | $26,600 | $0 | $0 |
| 2019 | $1,970 | $22,600 | $0 | $0 |
| 2018 | $1,223 | $18,500 | $0 | $0 |
| 2017 | $1,063 | $18,000 | $0 | $0 |
| 2016 | $2,331 | $16,200 | $0 | $0 |
| 2015 | $1,880 | $18,800 | $0 | $0 |
| 2013 | $2,640 | $26,400 | $0 | $0 |
| 2012 | $2,044 | $29,900 | $3,100 | $26,800 |
Source: Public Records
Map
Nearby Homes
- 4770 Matthew St
- 29600 Pine St
- 4705 S Middlebelt Rd
- 4971 Julius Blvd
- 5022 S Middlebelt Rd
- 29114 Richard St
- 29635 Julius Blvd
- 29119 York St
- 5320 S Middlebelt Rd
- Vacant Wayland Ct
- 29038 York St
- 29006 Eton St
- 29026 York St
- 29870 Lacy Dr Unit 132
- 29978 Carlysle St
- 29025 Powers St
- 28951 Powers St
- 28919 Powers St
- 29120 van Born Rd
- 4080 Isabelle St
- 4554 Burton St
- 4598 Burton St
- 4538 Burton St
- 30024 Annapolis Cir
- 30012 Annapolis Cir
- 30036 Annapolis Cir
- 4516 Burton St
- 30048 Annapolis Cir
- 30055 Annapolis Rd
- 30076 Annapolis Cir
- 30052 Annapolis Cir
- 30088 Annapolis Cir
- 30064 Annapolis Cir
- 29745 Annapolis Rd
- 29745 Annapolis Rd
- 29745 Annapolis Rd
- 30114 Annapolis Terrace
- 30126 Annapolis Terrace
- 30102 Annapolis Terrace
- 29668 Thomas Ct