Estimated Value: $296,289 - $343,000
--
Bed
2
Baths
948
Sq Ft
$345/Sq Ft
Est. Value
About This Home
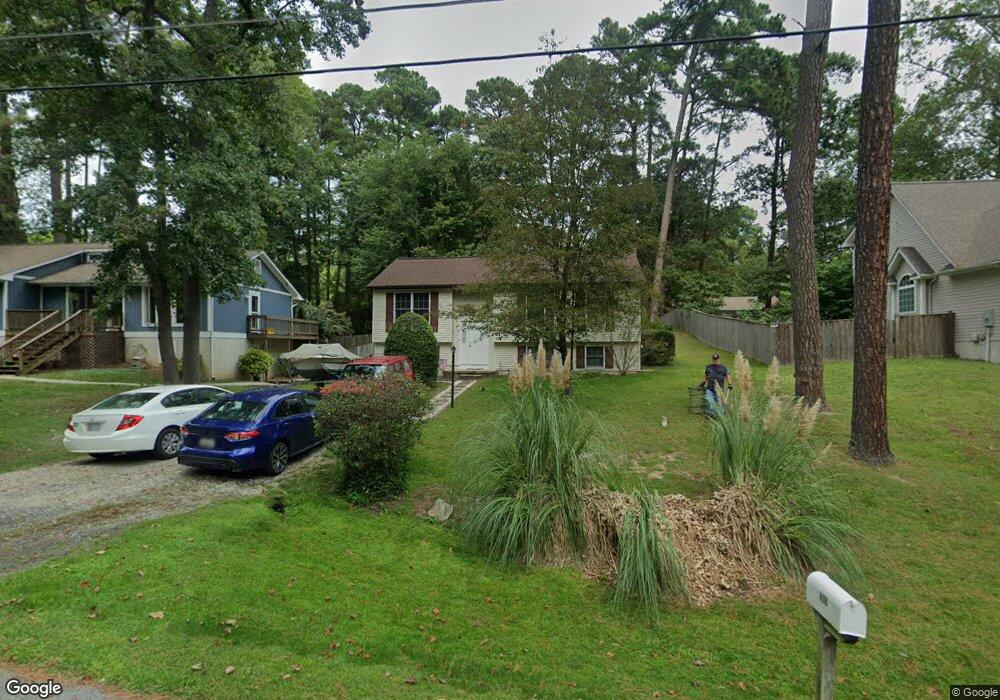
This home is located at 458 Buckler Dr, Lusby, MD 20657 and is currently estimated at $327,072, approximately $345 per square foot. 458 Buckler Dr is a home located in Calvert County with nearby schools including Dowell Elementary School, Mill Creek Middle School, and Patuxent High School.
Ownership History
Date
Name
Owned For
Owner Type
Purchase Details
Closed on
Aug 7, 1990
Sold by
Willingham Howard A and Willingham Gwendolyn H
Bought by
Hunt Timothy J and Hunt Beth B
Current Estimated Value
Home Financials for this Owner
Home Financials are based on the most recent Mortgage that was taken out on this home.
Original Mortgage
$92,000
Interest Rate
9.84%
Purchase Details
Closed on
Nov 24, 1987
Sold by
Mullins Everett and Mullins Mary Y
Bought by
Willingham Howard Allen
Create a Home Valuation Report for This Property
The Home Valuation Report is an in-depth analysis detailing your home's value as well as a comparison with similar homes in the area
Home Values in the Area
Average Home Value in this Area
Purchase History
| Date | Buyer | Sale Price | Title Company |
|---|---|---|---|
| Hunt Timothy J | $97,000 | -- | |
| Willingham Howard Allen | $5,200 | -- |
Source: Public Records
Mortgage History
| Date | Status | Borrower | Loan Amount |
|---|---|---|---|
| Closed | Hunt Timothy J | $92,000 |
Source: Public Records
Tax History Compared to Growth
Tax History
| Year | Tax Paid | Tax Assessment Tax Assessment Total Assessment is a certain percentage of the fair market value that is determined by local assessors to be the total taxable value of land and additions on the property. | Land | Improvement |
|---|---|---|---|---|
| 2025 | $2,850 | $245,333 | $0 | $0 |
| 2024 | $2,850 | $227,767 | $0 | $0 |
| 2023 | $2,573 | $210,200 | $77,600 | $132,600 |
| 2022 | $2,134 | $205,433 | $0 | $0 |
| 2021 | $5,041 | $200,667 | $0 | $0 |
| 2020 | $2,365 | $195,900 | $77,600 | $118,300 |
| 2019 | $2,040 | $194,500 | $0 | $0 |
| 2018 | $2,026 | $193,100 | $0 | $0 |
| 2017 | $2,294 | $191,700 | $0 | $0 |
| 2016 | -- | $187,633 | $0 | $0 |
| 2015 | $2,235 | $183,567 | $0 | $0 |
| 2014 | $2,235 | $179,500 | $0 | $0 |
Source: Public Records
Map
Nearby Homes