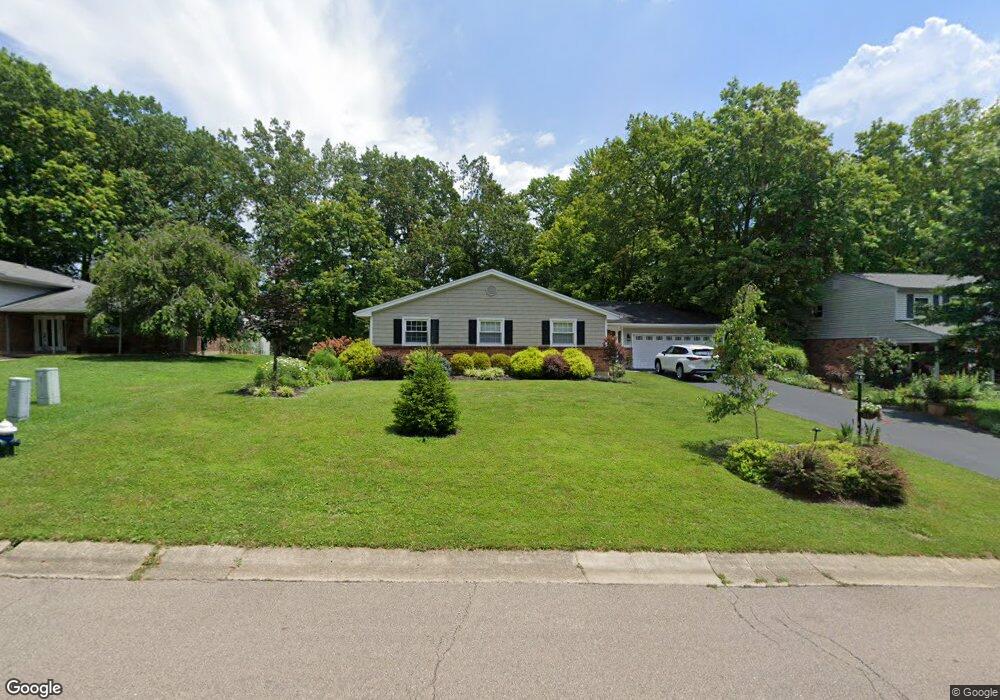
458 Pintail Dr Loveland, OH 45140
Estimated Value: $387,000 - $505,000
3
Beds
3
Baths
2,183
Sq Ft
$210/Sq Ft
Est. Value
About This Home
This home is located at 458 Pintail Dr, Loveland, OH 45140 and is currently estimated at $457,681, approximately $209 per square foot. 458 Pintail Dr is a home located in Hamilton County with nearby schools including Loveland Intermediate School, Loveland Primary School, and Loveland Elementary School.
Ownership History
Date
Name
Owned For
Owner Type
Purchase Details
Closed on
Jun 30, 1998
Sold by
Willhite Richard H and Willhite Candace L
Bought by
Centers David A and Centers Deborah N
Current Estimated Value
Home Financials for this Owner
Home Financials are based on the most recent Mortgage that was taken out on this home.
Original Mortgage
$118,800
Outstanding Balance
$24,693
Interest Rate
7.18%
Estimated Equity
$432,988
Purchase Details
Closed on
Jun 30, 1997
Sold by
Blaze Francis M and Blaze Beverly W
Bought by
Willhite Richard H and Willhite Candace L
Home Financials for this Owner
Home Financials are based on the most recent Mortgage that was taken out on this home.
Original Mortgage
$115,000
Interest Rate
8.01%
Purchase Details
Closed on
Dec 11, 1993
Sold by
Blaze Francis M and Blaze Beverly W
Bought by
Blaze Francis M and Blaze Beverly W
Create a Home Valuation Report for This Property
The Home Valuation Report is an in-depth analysis detailing your home's value as well as a comparison with similar homes in the area
Home Values in the Area
Average Home Value in this Area
Purchase History
| Date | Buyer | Sale Price | Title Company |
|---|---|---|---|
| Centers David A | $143,500 | -- | |
| Willhite Richard H | $130,000 | -- | |
| Blaze Francis M | -- | -- |
Source: Public Records
Mortgage History
| Date | Status | Borrower | Loan Amount |
|---|---|---|---|
| Open | Centers David A | $118,800 | |
| Previous Owner | Willhite Richard H | $115,000 |
Source: Public Records
Tax History Compared to Growth
Tax History
| Year | Tax Paid | Tax Assessment Tax Assessment Total Assessment is a certain percentage of the fair market value that is determined by local assessors to be the total taxable value of land and additions on the property. | Land | Improvement |
|---|---|---|---|---|
| 2024 | $6,349 | $120,425 | $24,276 | $96,149 |
| 2023 | $6,529 | $120,425 | $24,276 | $96,149 |
| 2022 | $5,049 | $78,099 | $19,880 | $58,219 |
| 2021 | $4,791 | $78,099 | $19,880 | $58,219 |
| 2020 | $4,867 | $78,099 | $19,880 | $58,219 |
| 2019 | $4,449 | $66,753 | $16,993 | $49,760 |
| 2018 | $4,476 | $66,753 | $16,993 | $49,760 |
| 2017 | $4,244 | $66,753 | $16,993 | $49,760 |
| 2016 | $4,320 | $65,065 | $15,778 | $49,287 |
| 2015 | $4,367 | $65,065 | $15,778 | $49,287 |
| 2014 | $4,471 | $65,065 | $15,778 | $49,287 |
| 2013 | $3,944 | $62,563 | $15,173 | $47,390 |
Source: Public Records
Map
Nearby Homes
- 160 Lexington Dr
- 124 Pheasantlake Dr
- 796 Oak Canyon Dr
- 196 Shoemaker Dr
- 131 Lakeview Ct
- 1864 W Loveland Ave
- 142 Lakeview Ct
- 882 Quailwoods Dr
- 736 Mohican Dr
- 228 Tuscarora Dr
- 6 Ridge Cir
- 185 Dogwood Dr
- 167 Dogwood Dr
- 508 Navaho Dr
- 247 Sinclair Ct
- 1886 Lindenhall Dr
- 1873 Heidelberg Dr
- 1306 W Loveland Ave
- 1008 W Main St
- 104 Cherokee Dr
- 464 Pintail Dr
- 452 Pintail Dr
- 101 Lexington Dr
- 470 Pintail Dr
- 107 Lexington Dr
- 446 Pintail Dr
- 113 Lexington Dr
- 445 Pintail Dr
- 100 Lexington Dr
- 476 Pintail Dr
- 439 Pintail Dr
- 457 Pintail Dr
- 1705 Tanglewood Dr
- 119 Lexington Dr
- 385 Pintail Dr
- 106 Lexington Dr
- 482 Pintail Dr
- 433 Pintail Dr
- 107 Churchill Ct
- 1706 Tanglewood Dr