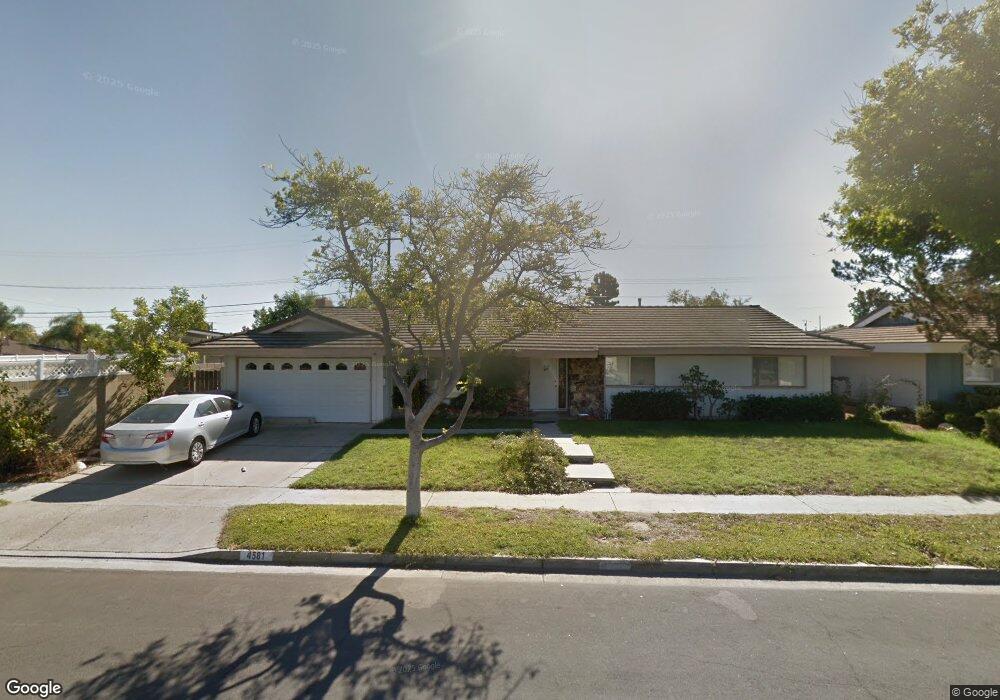
4581 Casa Oro Dr Yorba Linda, CA 92886
Estimated Value: $1,108,000 - $1,337,000
3
Beds
2
Baths
1,812
Sq Ft
$660/Sq Ft
Est. Value
About This Home
This home is located at 4581 Casa Oro Dr, Yorba Linda, CA 92886 and is currently estimated at $1,195,872, approximately $659 per square foot. 4581 Casa Oro Dr is a home located in Orange County with nearby schools including Rose Drive Elementary, Yorba Linda Middle School, and El Dorado High School.
Ownership History
Date
Name
Owned For
Owner Type
Purchase Details
Closed on
Feb 14, 2013
Sold by
Park Youngsoo and Park Julie Kim
Bought by
Park Youngsoo and Park Julie Kim
Current Estimated Value
Home Financials for this Owner
Home Financials are based on the most recent Mortgage that was taken out on this home.
Original Mortgage
$318,000
Outstanding Balance
$221,785
Interest Rate
3.36%
Mortgage Type
New Conventional
Estimated Equity
$974,087
Purchase Details
Closed on
Jul 27, 2011
Sold by
Sahagun Mayra
Bought by
Park Youngsoo and Kim Julie H
Home Financials for this Owner
Home Financials are based on the most recent Mortgage that was taken out on this home.
Original Mortgage
$328,000
Interest Rate
4.43%
Mortgage Type
New Conventional
Purchase Details
Closed on
Aug 8, 2000
Sold by
Cowan Yip and Cowan Betty
Bought by
Sahagun Rigoberto S
Home Financials for this Owner
Home Financials are based on the most recent Mortgage that was taken out on this home.
Original Mortgage
$242,760
Interest Rate
9.85%
Create a Home Valuation Report for This Property
The Home Valuation Report is an in-depth analysis detailing your home's value as well as a comparison with similar homes in the area
Home Values in the Area
Average Home Value in this Area
Purchase History
| Date | Buyer | Sale Price | Title Company |
|---|---|---|---|
| Park Youngsoo | -- | First American Title Company | |
| Park Youngsoo | $410,000 | Lawyers Title | |
| Sahagun Rigoberto S | $303,500 | -- |
Source: Public Records
Mortgage History
| Date | Status | Borrower | Loan Amount |
|---|---|---|---|
| Open | Park Youngsoo | $318,000 | |
| Closed | Park Youngsoo | $328,000 | |
| Previous Owner | Sahagun Rigoberto S | $242,760 |
Source: Public Records
Tax History Compared to Growth
Tax History
| Year | Tax Paid | Tax Assessment Tax Assessment Total Assessment is a certain percentage of the fair market value that is determined by local assessors to be the total taxable value of land and additions on the property. | Land | Improvement |
|---|---|---|---|---|
| 2025 | $5,911 | $514,977 | $387,124 | $127,853 |
| 2024 | $5,911 | $504,880 | $379,533 | $125,347 |
| 2023 | $5,800 | $494,981 | $372,091 | $122,890 |
| 2022 | $5,736 | $485,276 | $364,795 | $120,481 |
| 2021 | $5,631 | $475,761 | $357,642 | $118,119 |
| 2020 | $5,530 | $470,883 | $353,975 | $116,908 |
| 2019 | $5,337 | $461,650 | $347,034 | $114,616 |
| 2018 | $5,269 | $452,599 | $340,230 | $112,369 |
| 2017 | $5,182 | $443,725 | $333,559 | $110,166 |
| 2016 | $5,078 | $435,025 | $327,019 | $108,006 |
| 2015 | $5,015 | $428,491 | $322,107 | $106,384 |
| 2014 | $4,867 | $420,098 | $315,797 | $104,301 |
Source: Public Records
Map
Nearby Homes
- 4654 Prospect Ln
- 4781 Kona Kove Way
- 4802 Brookway Ave
- 11715 Rose Dr
- 1429 Prospect Ave Unit B
- 16692 Meadowview Dr
- 17001 La Kenice Way
- 4215 Sand Rock Cir
- 5130 Webb Place
- 17781 Lerene Dr
- 4571 Mimosa Dr
- 4942 Gem Ln
- 1261 Desoto St
- 943 Berkenstock Ln
- 4891 Eureka Ave Unit 25
- 4845 Eisenhower Ct
- 4882 Kermath St
- 4302 Eureka Ave
- 5141 Siesta Ln
- 16942 Lake Park Way
- 4591 Casa Oro Dr
- 4571 Casa Oro Dr
- 4612 Briarhill Dr
- 4601 Casa Oro Dr
- 4602 Briarhill Dr
- 4572 Casa Oro Dr
- 4561 Casa Oro Dr
- 4576 Casa Oro Dr
- 4622 Briarhill Dr
- 4562 Casa Oro Dr
- 4592 Briarhill Dr
- 4611 Casa Oro Dr
- 4580 Casa Oro Dr
- 4584 Casa Oro Dr
- 4551 Casa Oro Dr
- 17291 Coralwood Cir
- 17242 El Cajon Ave
- 4552 Casa Oro Dr
- 4592 Casa Oro Dr
- 4632 Briarhill Dr