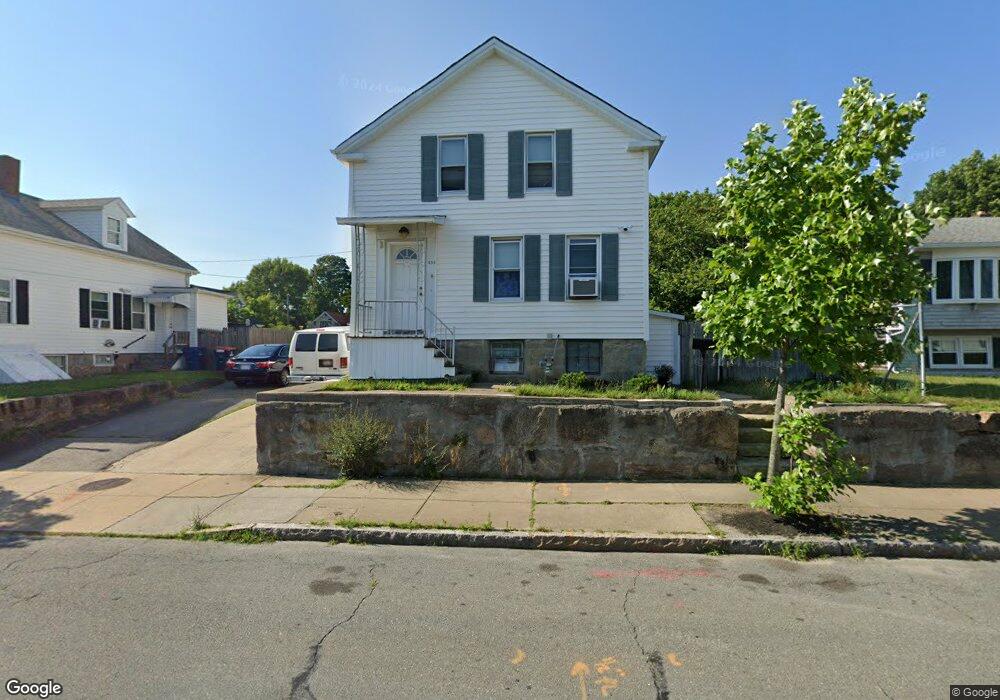
459 Allen St New Bedford, MA 02740
Downtown New Bedford NeighborhoodEstimated Value: $438,000 - $443,000
4
Beds
2
Baths
1,507
Sq Ft
$292/Sq Ft
Est. Value
About This Home
This home is located at 459 Allen St, New Bedford, MA 02740 and is currently estimated at $440,082, approximately $292 per square foot. 459 Allen St is a home located in Bristol County with nearby schools including Betsey B. Winslow Elementary School, Keith Middle School, and New Bedford High School.
Ownership History
Date
Name
Owned For
Owner Type
Purchase Details
Closed on
Jul 14, 2011
Sold by
Lovos Jose D
Bought by
Flores Rosa I
Current Estimated Value
Purchase Details
Closed on
Jul 3, 2006
Sold by
Resendes Gracionilde Mon and Resende Gracionilde Mon
Bought by
Lovos Jose D and Flores Rosa I
Home Financials for this Owner
Home Financials are based on the most recent Mortgage that was taken out on this home.
Original Mortgage
$184,000
Interest Rate
6.58%
Mortgage Type
Purchase Money Mortgage
Purchase Details
Closed on
Sep 1, 2004
Sold by
Vincent Cynthia M
Bought by
Resende Gracionilde Mon and Rego Luis
Purchase Details
Closed on
Mar 10, 2004
Sold by
Cunningham Chad and Avila Karen A
Bought by
Vincent Cynthia M and Cunningham Chad
Create a Home Valuation Report for This Property
The Home Valuation Report is an in-depth analysis detailing your home's value as well as a comparison with similar homes in the area
Home Values in the Area
Average Home Value in this Area
Purchase History
| Date | Buyer | Sale Price | Title Company |
|---|---|---|---|
| Flores Rosa I | -- | -- | |
| Flores Rosa I | -- | -- | |
| Lovos Jose D | $230,000 | -- | |
| Lovos Jose D | $230,000 | -- | |
| Resende Gracionilde Mon | $245,000 | -- | |
| Resende Gracionilde Mon | $245,000 | -- | |
| Vincent Cynthia M | $184,500 | -- | |
| Vincent Cynthia M | $184,500 | -- |
Source: Public Records
Mortgage History
| Date | Status | Borrower | Loan Amount |
|---|---|---|---|
| Previous Owner | Vincent Cynthia M | $182,482 | |
| Previous Owner | Vincent Cynthia M | $184,000 | |
| Previous Owner | Vincent Cynthia M | $31,000 |
Source: Public Records
Tax History Compared to Growth
Tax History
| Year | Tax Paid | Tax Assessment Tax Assessment Total Assessment is a certain percentage of the fair market value that is determined by local assessors to be the total taxable value of land and additions on the property. | Land | Improvement |
|---|---|---|---|---|
| 2025 | $4,109 | $363,300 | $115,800 | $247,500 |
| 2024 | $3,787 | $315,600 | $117,700 | $197,900 |
| 2023 | $3,991 | $279,300 | $101,500 | $177,800 |
| 2022 | $3,765 | $242,300 | $96,500 | $145,800 |
| 2021 | $3,668 | $235,300 | $96,500 | $138,800 |
| 2020 | $3,678 | $227,600 | $96,500 | $131,100 |
| 2019 | $3,628 | $220,300 | $96,500 | $123,800 |
| 2018 | $3,447 | $207,300 | $96,500 | $110,800 |
| 2017 | $3,268 | $195,800 | $96,500 | $99,300 |
| 2016 | $3,127 | $189,600 | $96,500 | $93,100 |
| 2015 | $2,893 | $183,900 | $96,500 | $87,400 |
| 2014 | $2,659 | $175,400 | $90,700 | $84,700 |
Source: Public Records
Map
Nearby Homes